
Portugal vs Italia: PIB, 1960–2025
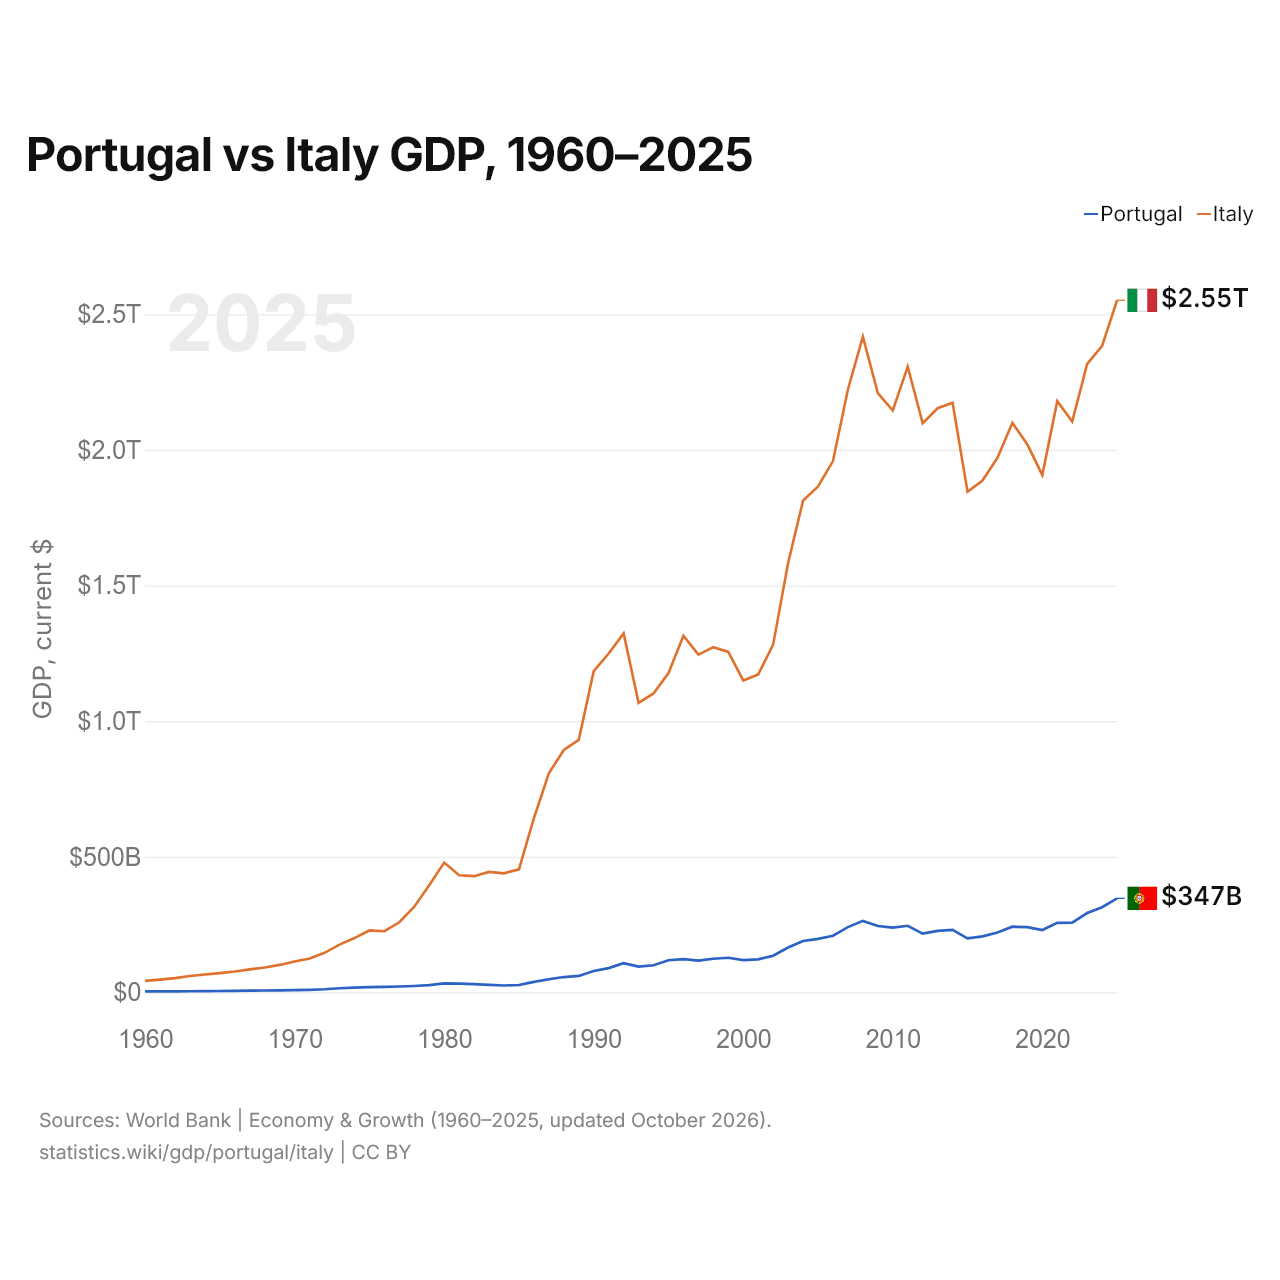
| Año | PIB, US$ corrientes | |
|---|---|---|
 Portugal |
 Italia |
|
| 2025 | 346.639.825.142 US$ | 2.551.556.954.100 US$ |
| 2024 | 313.656.884.871 US$ | 2.383.435.562.458 US$ |
| 2023 | 292.323.800.949 US$ | 2.316.882.296.366 US$ |
| 2022 | 256.898.677.175 US$ | 2.104.067.630.319 US$ |
| 2021 | 256.055.879.091 US$ | 2.179.207.773.596 US$ |
| 2020 | 229.618.773.423 US$ | 1.907.481.094.079 US$ |
| 2019 | 240.115.970.063 US$ | 2.019.606.796.584 US$ |
| 2018 | 242.092.894.543 US$ | 2.099.435.266.459 US$ |
| 2017 | 220.862.990.767 US$ | 1.970.720.904.585 US$ |
| 2016 | 206.305.431.242 US$ | 1.887.111.188.177 US$ |
| 2015 | 199.038.523.120 US$ | 1.845.428.048.839 US$ |
| 2014 | 230.078.616.300 US$ | 2.173.255.507.986 US$ |
| 2013 | 226.677.408.292 US$ | 2.153.225.581.941 US$ |
| 2012 | 216.536.676.772 US$ | 2.097.929.495.122 US$ |
| 2011 | 245.426.767.676 US$ | 2.306.974.020.278 US$ |
| 2010 | 238.443.864.993 US$ | 2.144.936.254.535 US$ |
| 2009 | 244.667.762.836 US$ | 2.209.484.319.013 US$ |
| 2008 | 263.416.394.624 US$ | 2.417.508.414.187 US$ |
| 2007 | 240.496.147.317 US$ | 2.222.524.108.128 US$ |
| 2006 | 208.756.449.276 US$ | 1.958.563.654.386 US$ |
| 2005 | 197.253.876.705 US$ | 1.864.982.261.287 US$ |
| 2004 | 189.382.122.532 US$ | 1.812.808.753.295 US$ |
| 2003 | 165.226.175.537 US$ | 1.582.930.016.539 US$ |
| 2002 | 134.795.565.549 US$ | 1.281.746.271.196 US$ |
| 2001 | 121.604.107.165 US$ | 1.172.041.488.806 US$ |
| 2000 | 118.605.192.877 US$ | 1.149.661.363.439 US$ |
| 1999 | 127.470.385.557 US$ | 1.255.004.736.464 US$ |
| 1998 | 123.946.327.916 US$ | 1.272.729.786.997 US$ |
| 1997 | 117.016.535.163 US$ | 1.244.988.176.444 US$ |
| 1996 | 122.630.089.680 US$ | 1.314.776.508.972 US$ |
| 1995 | 118.122.007.430 US$ | 1.177.369.428.266 US$ |
| 1994 | 99.688.641.304 US$ | 1.101.750.159.702 US$ |
| 1993 | 95.009.751.901 US$ | 1.067.412.587.671 US$ |
| 1992 | 107.592.098.307 US$ | 1.323.204.350.354 US$ |
| 1991 | 89.233.599.278 US$ | 1.249.092.439.519 US$ |
| 1990 | 78.713.860.217 US$ | 1.183.945.130.899 US$ |
| 1989 | 60.594.092.182 US$ | 930.801.709.004 US$ |
| 1988 | 56.347.250.696 US$ | 893.663.934.841 US$ |
| 1987 | 48.182.925.857 US$ | 807.570.134.449 US$ |
| 1986 | 38.745.901.354 US$ | 641.862.313.287 US$ |
| 1985 | 27.115.807.742 US$ | 453.259.761.687 US$ |
| 1984 | 25.217.969.050 US$ | 438.896.930.791 US$ |
| 1983 | 27.239.650.742 US$ | 444.063.496.940 US$ |
| 1982 | 30.527.754.793 US$ | 428.257.421.618 US$ |
| 1981 | 31.977.276.873 US$ | 431.695.533.981 US$ |
| 1980 | 32.896.519.824 US$ | 478.356.755.596 US$ |
| 1979 | 26.622.819.672 US$ | 394.584.507.108 US$ |
| 1978 | 23.487.614.051 US$ | 315.784.469.541 US$ |
| 1977 | 21.439.523.311 US$ | 258.190.019.750 US$ |
| 1976 | 20.332.831.565 US$ | 225.235.205.862 US$ |
| 1975 | 19.347.607.843 US$ | 228.220.643.535 US$ |
| 1974 | 17.512.391.476 US$ | 200.024.444.775 US$ |
| 1973 | 15.090.564.186 US$ | 175.896.529.392 US$ |
| 1972 | 11.239.117.865 US$ | 145.594.833.997 US$ |
| 1971 | 9.201.604.240 US$ | 124.959.712.859 US$ |
| 1970 | 8.108.235.704 US$ | 113.656.669.765 US$ |
| 1969 | 7.287.555.035 US$ | 100.996.667.239 US$ |
| 1968 | 6.644.693.214 US$ | 91.485.448.148 US$ |
| 1967 | 6.002.607.030 US$ | 84.401.995.573 US$ |
| 1966 | 5.370.108.031 US$ | 76.622.444.787 US$ |
| 1965 | 4.901.711.248 US$ | 70.717.012.186 US$ |
| 1964 | 4.429.202.657 US$ | 65.720.771.779 US$ |
| 1963 | 4.084.251.593 US$ | 60.035.924.618 US$ |
| 1962 | 3.835.883.663 US$ | 52.413.872.628 US$ |
| 1961 | 3.573.719.085 US$ | 46.649.487.320 US$ |
| 1960 | 3.339.150.158 US$ | 42.012.422.612 US$ |
En 2025, el PIB de Italia (2,55 billones de US$) fue 7,4 veces el de Portugal (347 mil millones de US$). En 2015 era 9,3 veces. De 2015 a 2025, a precios constantes de 2015, el PIB de Italia creció un 10,8 % y el de Portugal, un 24,0 %.
Desde 1960, el PIB de Italia ha sido cada año el mayor de los dos; en 1960, era 13 veces el de Portugal. En 2025, el PIB per cápita fue de 32.082 US$ en Portugal y de 43.309 US$ en Italia: un 35 % más alto en Italia.
Portugal vs Italia: últimos datos del PIB
|
Portugal
|
Italia
|
|
|---|---|---|
| PIB, US$ corrientes | 347 mil M US$ | 2,55 B US$ |
| Puesto mundial | 46/197 | 9/197 |
| Porcentaje del mundo | 0,29 % | 2,16 % |
| PIB, US$ constantes de 2015 | 247 mil M US$ | 2,05 B US$ |
| Diferencia de PIB | 0,14× | 7,4× |
Comparar el PIB de 2 países cualesquiera
Fuentes:
- Banco Mundial | Economía y crecimiento (1960–2025, actualizado en octubre de 2026)
Creative Commons Atribución (CC BY): puedes copiar, compartir, adaptar y reutilizar este contenido, también con fines comerciales, siempre que cites a statistics.wiki e indiques los cambios que hayas hecho. Las fuentes indicadas arriba pueden tener sus propias condiciones de licencia.