
Portugal vs Irlanda: PIB, 1960–2025
| Año | PIB, US$ corrientes | |
|---|---|---|
 Portugal |
 Irlanda |
|
| 2025 | 346.639.825.142 US$ | 721.701.359.046 US$ |
| 2024 | 313.656.884.871 US$ | 609.157.459.747 US$ |
| 2023 | 292.323.800.949 US$ | 567.372.737.459 US$ |
| 2022 | 256.898.677.175 US$ | 548.341.794.599 US$ |
| 2021 | 256.055.879.091 US$ | 530.394.123.830 US$ |
| 2020 | 229.618.773.423 US$ | 436.009.027.819 US$ |
| 2019 | 240.115.970.063 US$ | 407.211.793.801 US$ |
| 2018 | 242.092.894.543 US$ | 395.780.319.817 US$ |
| 2017 | 220.862.990.767 US$ | 348.355.212.569 US$ |
| 2016 | 206.305.431.242 US$ | 305.431.252.709 US$ |
| 2015 | 199.038.523.120 US$ | 302.101.388.556 US$ |
| 2014 | 230.078.616.300 US$ | 266.490.442.124 US$ |
| 2013 | 226.677.408.292 US$ | 242.924.245.719 US$ |
| 2012 | 216.536.676.772 US$ | 226.921.827.888 US$ |
| 2011 | 245.426.767.676 US$ | 240.975.871.047 US$ |
| 2010 | 238.443.864.993 US$ | 221.732.824.603 US$ |
| 2009 | 244.667.762.836 US$ | 236.443.115.854 US$ |
| 2008 | 263.416.394.624 US$ | 275.447.471.451 US$ |
| 2007 | 240.496.147.317 US$ | 270.079.279.420 US$ |
| 2006 | 208.756.449.276 US$ | 232.180.617.162 US$ |
| 2005 | 197.253.876.705 US$ | 211.876.989.656 US$ |
| 2004 | 189.382.122.532 US$ | 194.372.115.041 US$ |
| 2003 | 165.226.175.537 US$ | 164.670.771.260 US$ |
| 2002 | 134.795.565.549 US$ | 128.596.035.288 US$ |
| 2001 | 121.604.107.165 US$ | 109.346.669.230 US$ |
| 2000 | 118.605.192.877 US$ | 100.207.610.430 US$ |
| 1999 | 127.470.385.557 US$ | 98.893.958.263 US$ |
| 1998 | 123.946.327.916 US$ | 90.199.410.116 US$ |
| 1997 | 117.016.535.163 US$ | 82.856.648.758 US$ |
| 1996 | 122.630.089.680 US$ | 75.790.786.290 US$ |
| 1995 | 118.122.007.430 US$ | 69.139.823.232 US$ |
| 1994 | 99.688.641.304 US$ | 57.097.656.066 US$ |
| 1993 | 95.009.751.901 US$ | 52.417.477.614 US$ |
| 1992 | 107.592.098.307 US$ | 55.918.538.121 US$ |
| 1991 | 89.233.599.278 US$ | 49.787.501.584 US$ |
| 1990 | 78.713.860.217 US$ | 49.305.632.408 US$ |
| 1989 | 60.594.092.182 US$ | 39.238.392.678 US$ |
| 1988 | 56.347.250.696 US$ | 37.772.896.221 US$ |
| 1987 | 48.182.925.857 US$ | 33.920.518.493 US$ |
| 1986 | 38.745.901.354 US$ | 28.714.571.852 US$ |
| 1985 | 27.115.807.742 US$ | 21.270.013.326 US$ |
| 1984 | 25.217.969.050 US$ | 20.106.648.455 US$ |
| 1983 | 27.239.650.742 US$ | 20.766.047.764 US$ |
| 1982 | 30.527.754.793 US$ | 21.474.752.962 US$ |
| 1981 | 31.977.276.873 US$ | 20.670.190.138 US$ |
| 1980 | 32.896.519.824 US$ | 21.747.855.640 US$ |
| 1979 | 26.622.819.672 US$ | 18.319.334.300 US$ |
| 1978 | 23.487.614.051 US$ | 14.647.996.074 US$ |
| 1977 | 21.439.523.311 US$ | 11.248.340.431 US$ |
| 1976 | 20.332.831.565 US$ | 9.453.756.015 US$ |
| 1975 | 19.347.607.843 US$ | 9.483.808.362 US$ |
| 1974 | 17.512.391.476 US$ | 7.896.860.615 US$ |
| 1973 | 15.090.564.186 US$ | 7.481.173.066 US$ |
| 1972 | 11.239.117.865 US$ | 6.318.060.582 US$ |
| 1971 | 9.201.604.240 US$ | 5.098.250.287 US$ |
| 1970 | 8.108.235.704 US$ | 4.395.995.086 US$ |
| 1969 | 7.287.555.035 US$ | 3.902.721.632 US$ |
| 1968 | 6.644.693.214 US$ | 3.378.701.147 US$ |
| 1967 | 6.002.607.030 US$ | 3.445.739.915 US$ |
| 1966 | 5.370.108.031 US$ | 3.198.820.904 US$ |
| 1965 | 4.901.711.248 US$ | 3.035.655.794 US$ |
| 1964 | 4.429.202.657 US$ | 2.851.091.646 US$ |
| 1963 | 4.084.251.593 US$ | 2.505.073.358 US$ |
| 1962 | 3.835.883.663 US$ | 2.329.372.972 US$ |
| 1961 | 3.573.719.085 US$ | 2.151.772.980 US$ |
| 1960 | 3.339.150.158 US$ | 1.998.550.222 US$ |
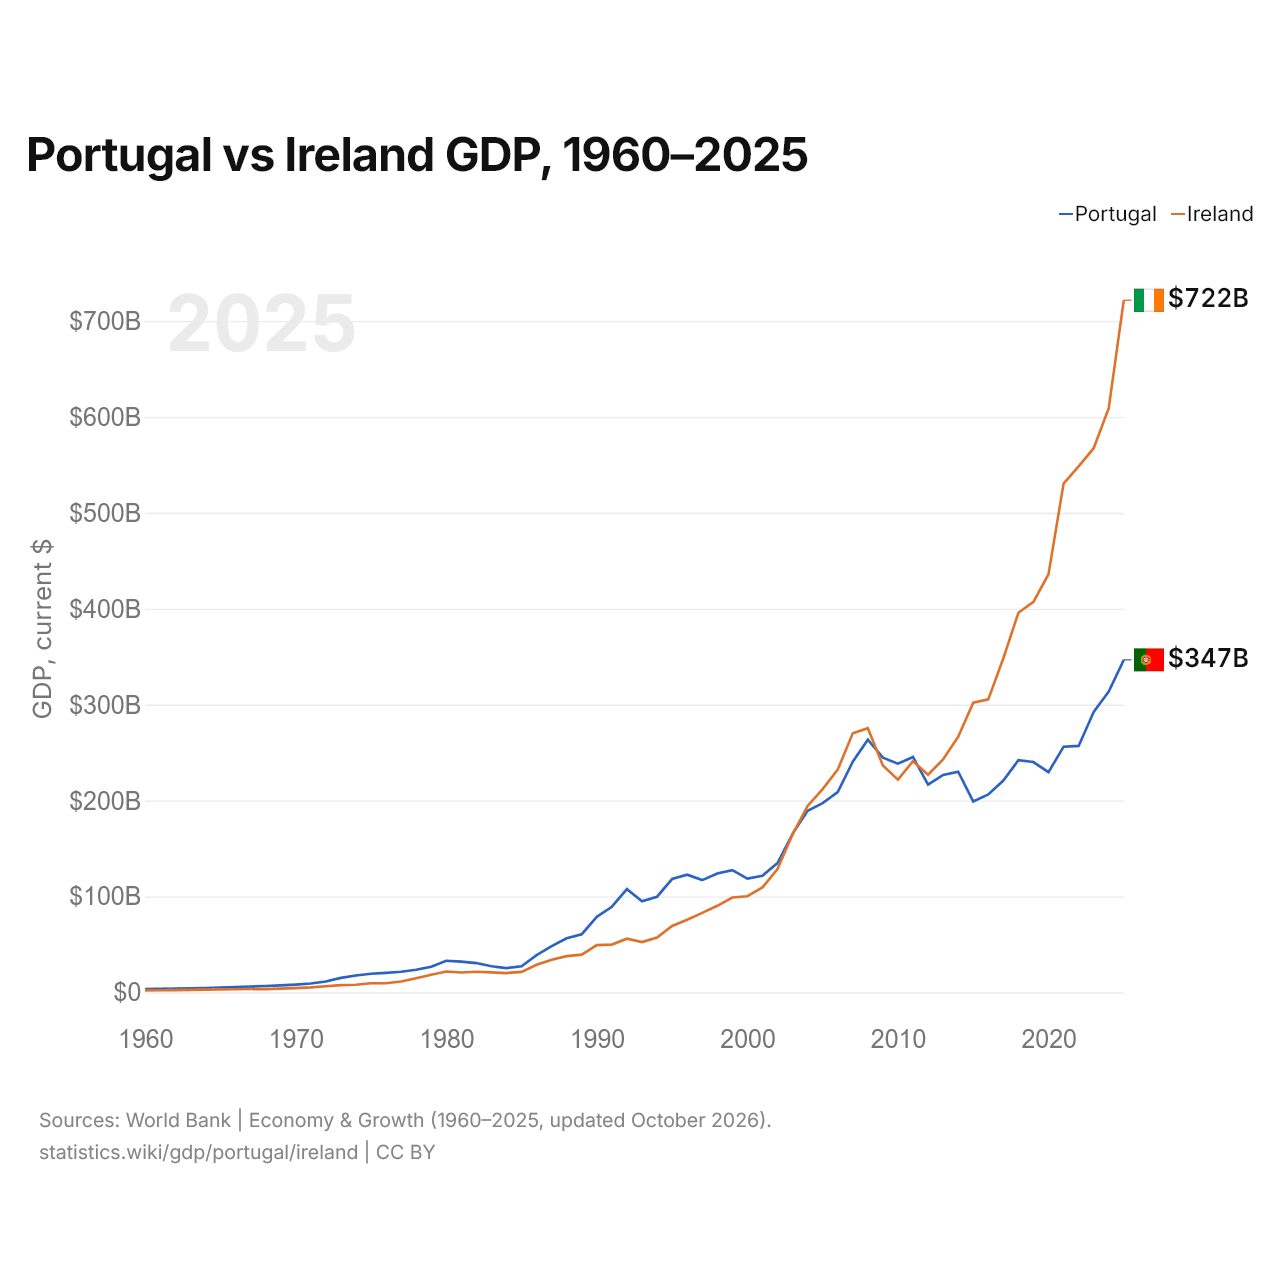
En 2025, el PIB de Irlanda (722 mil millones de US$) fue 2,1 veces el de Portugal (347 mil millones de US$). En 2015 era 1,5 veces. De 2015 a 2025, a precios constantes de 2015, el PIB de Irlanda creció un 89,6 % y el de Portugal, un 24,0 %.
Desde 2012, el PIB de Irlanda es el mayor de los dos; en 1960, el de Portugal era 1,7 veces el de Irlanda. En 2025, el PIB per cápita fue de 32.082 US$ en Portugal y de 131.592 US$ en Irlanda: 4,1 veces más alto en Irlanda.
Portugal vs Irlanda: últimos datos del PIB
|
Portugal
|
Irlanda
|
|
|---|---|---|
| PIB, US$ corrientes | 347 mil M US$ | 722 mil M US$ |
| Puesto mundial | 46/197 | 24/197 |
| Porcentaje del mundo | 0,29 % | 0,61 % |
| PIB, US$ constantes de 2015 | 247 mil M US$ | 573 mil M US$ |
| Diferencia de PIB | 0,48× | 2,1× |
Comparar el PIB de 2 países cualesquiera
Fuentes:
- Banco Mundial | Economía y crecimiento (1960–2025, actualizado en octubre de 2026)
Creative Commons Atribución (CC BY): puedes copiar, compartir, adaptar y reutilizar este contenido, también con fines comerciales, siempre que cites a statistics.wiki e indiques los cambios que hayas hecho. Las fuentes indicadas arriba pueden tener sus propias condiciones de licencia.