
Corea del Norte vs México: PIB per cápita, 1960–2025
1x
| Año | PIB per cápita, US$ corrientes | |
|---|---|---|
 Corea del Norte |
 México |
|
| 2025 | - | 13.889 US$ |
| 2024 | 1.319 US$ | 13.988 US$ |
| 2023 | 1.217 US$ | 13.831 US$ |
| 2022 | 1.100 US$ | 11.406 US$ |
| 2021 | 1.231 US$ | 10.314 US$ |
| 2020 | 1.061 US$ | 8.841 US$ |
| 2019 | 1.084 US$ | 10.370 US$ |
| 2018 | 1.100 US$ | 10.085 US$ |
| 2017 | 1.127 US$ | 9.649 US$ |
| 2016 | 1.124 US$ | 9.098 US$ |
| 2015 | 1.201 US$ | 10.021 US$ |
| 2014 | 1.201 US$ | 11.391 US$ |
| 2013 | 1.208 US$ | 11.217 US$ |
| 2012 | 1.186 US$ | 10.744 US$ |
| 2011 | 1.156 US$ | 10.664 US$ |
| 2010 | 1.040 US$ | 9.729 US$ |
| 2009 | 939 US$ | 8.424 US$ |
| 2008 | - | 10.524 US$ |
| 2007 | - | 10.134 US$ |
| 2006 | - | 9.513 US$ |
| 2005 | - | 8.672 US$ |
| 2004 | - | 7.850 US$ |
| 2003 | - | 7.434 US$ |
| 2002 | - | 7.983 US$ |
| 2001 | - | 7.953 US$ |
| 2000 | - | 7.524 US$ |
| 1999 | - | 6.500 US$ |
| 1998 | - | 5.833 US$ |
| 1997 | - | 5.567 US$ |
| 1996 | - | 4.674 US$ |
| 1995 | - | 4.184 US$ |
| 1994 | - | 6.202 US$ |
| 1993 | - | 6.048 US$ |
| 1992 | - | 4.221 US$ |
| 1991 | - | 3.709 US$ |
| 1990 | - | 3.154 US$ |
| 1989 | - | 2.725 US$ |
| 1988 | - | 2.279 US$ |
| 1987 | - | 1.888 US$ |
| 1986 | - | 1.757 US$ |
| 1985 | - | 2.602 US$ |
| 1984 | - | 2.506 US$ |
| 1983 | - | 2.170 US$ |
| 1982 | - | 2.621 US$ |
| 1981 | - | 3.829 US$ |
| 1980 | - | 3.055 US$ |
| 1979 | - | 2.049 US$ |
| 1978 | - | 1.604 US$ |
| 1977 | - | 1.315 US$ |
| 1976 | - | 1.465 US$ |
| 1975 | - | 1.492 US$ |
| 1974 | - | 1.256 US$ |
| 1973 | - | 993 US$ |
| 1972 | - | 837 US$ |
| 1971 | - | 748 US$ |
| 1970 | - | 699 US$ |
| 1969 | - | 660 US$ |
| 1968 | - | 616 US$ |
| 1967 | - | 576 US$ |
| 1966 | - | 545 US$ |
| 1965 | - | 506 US$ |
| 1964 | - | 481 US$ |
| 1963 | - | 420 US$ |
| 1962 | - | 388 US$ |
| 1961 | - | 374 US$ |
| 1960 | - | 355 US$ |
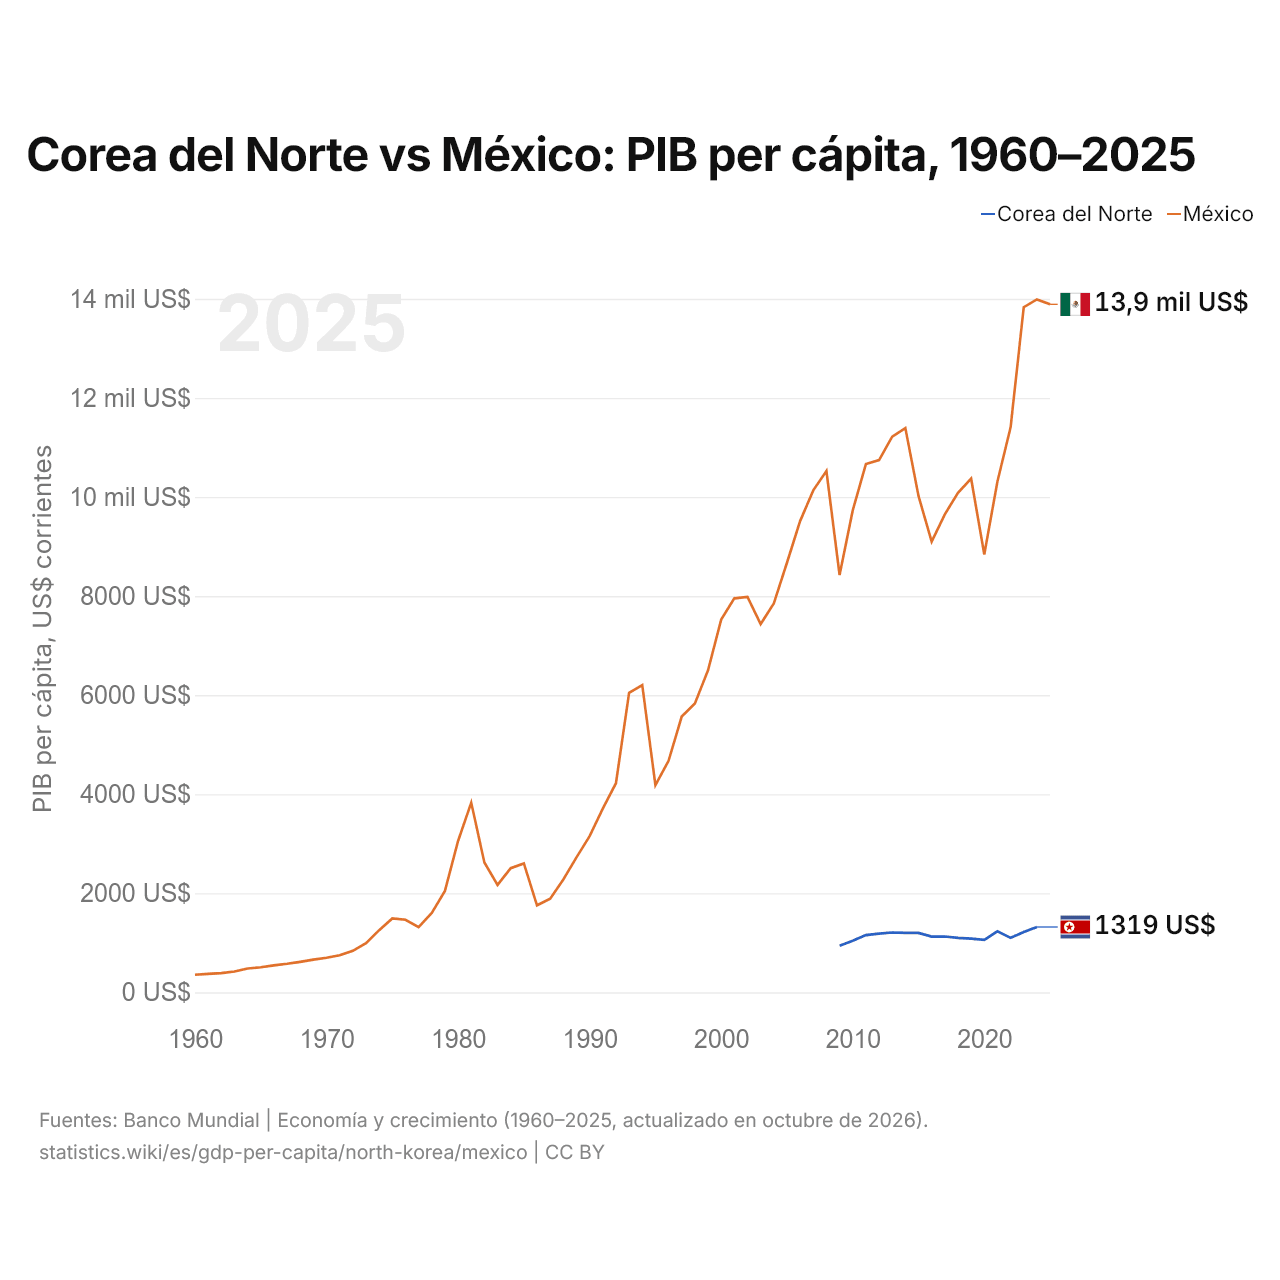
El PIB per cápita fue de 1319 US$ en Corea del Norte (2024) y de 13.988 US$ en México (2024): 11 veces más alto en México. En 2009 era de 939 US$ en Corea del Norte y de 8424 US$ en México, 9,0 veces más alto en México.
El PIB per cápita de México ha sido más alto que el de Corea del Norte todos los años desde 2009.
Corea del Norte vs México: últimos datos del PIB per cápita
|
Corea del Norte
|
México
|
|
|---|---|---|
| PIB per cápita, US$ corrientes | 1319 US$ (2024) | 13.889 US$ (2025) |
| Puesto mundial | 169/197 | 76/197 |
| × media mundial | 0,1× | 0,96× |
Comparar el PIB per cápita de 2 países cualesquiera
Fuentes:
- Banco Mundial | Economía y crecimiento (1960–2025, actualizado en octubre de 2026)
Creative Commons Atribución (CC BY): puedes copiar, compartir, adaptar y reutilizar este contenido, también con fines comerciales, siempre que cites a statistics.wiki e indiques los cambios que hayas hecho. Las fuentes indicadas arriba pueden tener sus propias condiciones de licencia.