
PIB per cápita de Mauricio, 1960–2025
| Año | PIB per cápita | Puesto mundial | |
|---|---|---|---|
| US$ corrientes | US$ constantes de 2015 | ||
| 2025 | 12.991 US$ | 12.315 US$ | #80 |
| 2024 | 11.991 US$ | 11.919 US$ | #77 |
| 2023 | 11.270 US$ | 11.331 US$ | #79 |
| 2022 | 10.247 US$ | 10.703 US$ | #77 |
| 2021 | 9.178 US$ | 9.849 US$ | #80 |
| 2020 | 9.136 US$ | 9.534 US$ | #70 |
| 2019 | 11.568 US$ | 11.111 US$ | #67 |
| 2018 | 11.819 US$ | 10.805 US$ | #64 |
| 2017 | 10.987 US$ | 10.384 US$ | #65 |
| 2016 | 10.095 US$ | 9.998 US$ | #66 |
| 2015 | 9.631 US$ | 9.631 US$ | #70 |
| 2014 | 10.490 US$ | 9.298 US$ | #71 |
| 2013 | 9.877 US$ | 8.969 US$ | #72 |
| 2012 | 9.422 US$ | 8.695 US$ | #74 |
| 2011 | 9.324 US$ | 8.423 US$ | #73 |
| 2010 | 8.113 US$ | 8.101 US$ | #76 |
| 2009 | 7.427 US$ | 7.778 US$ | #73 |
| 2008 | 8.140 US$ | 7.545 US$ | #73 |
| 2007 | 6.677 US$ | 7.180 US$ | #74 |
| 2006 | 5.784 US$ | 6.820 US$ | #75 |
| 2005 | 5.354 US$ | 6.534 US$ | #71 |
| 2004 | 5.461 US$ | 6.458 US$ | #66 |
| 2003 | 4.858 US$ | 6.229 US$ | #63 |
| 2002 | 4.073 US$ | 5.923 US$ | #68 |
| 2001 | 3.909 US$ | 5.870 US$ | #71 |
| 2000 | 3.982 US$ | 5.724 US$ | #69 |
| 1999 | 3.746 US$ | 5.343 US$ | #69 |
| 1998 | 3.642 US$ | 5.273 US$ | #70 |
| 1997 | 3.696 US$ | 5.024 US$ | #70 |
| 1996 | 3.952 US$ | 4.814 US$ | #65 |
| 1995 | 3.648 US$ | 4.606 US$ | #67 |
| 1994 | 3.240 US$ | 4.455 US$ | #64 |
| 1993 | 3.014 US$ | 4.338 US$ | #65 |
| 1992 | 3.013 US$ | 4.177 US$ | #65 |
| 1991 | 2.705 US$ | 3.974 US$ | #66 |
| 1990 | 2.540 US$ | 3.846 US$ | #70 |
| 1989 | 2.103 US$ | 3.614 US$ | #71 |
| 1988 | 2.074 US$ | 3.486 US$ | #71 |
| 1987 | 1.840 US$ | 3.287 US$ | #71 |
| 1986 | 1.442 US$ | 3.041 US$ | #78 |
| 1985 | 1.069 US$ | 2.793 US$ | #84 |
| 1984 | 1.042 US$ | 2.633 US$ | #90 |
| 1983 | 1.103 US$ | 2.541 US$ | #89 |
| 1982 | 1.101 US$ | 2.554 US$ | #87 |
| 1981 | 1.181 US$ | 2.451 US$ | #85 |
| 1980 | 1.187 US$ | 2.350 US$ | #82 |
| 1979 | 1.292 US$ | 2.657 US$ | #71 |
| 1978 | 1.102 US$ | 2.612 US$ | #73 |
| 1977 | 906 US$ | 2.548 US$ | #73 |
| 1976 | 787 US$ | 2.431 US$ | #72 |
| 1975 | 755 US$ | 1.996 US$ | #70 |
| 1974 | 763 US$ | 2.010 US$ | #69 |
| 1973 | 467 US$ | 1.875 US$ | #80 |
| 1972 | 374 US$ | 1.700 US$ | #83 |
| 1971 | 299,6 US$ | 1.593 US$ | #89 |
| 1970 | 271,3 US$ | 1.552 US$ | #90 |
| 1969 | 272,7 US$ | 1.584 US$ | #73 |
| 1968 | 258,7 US$ | 1.536 US$ | #73 |
| 1967 | 304 US$ | 1.681 US$ | #58 |
| 1966 | 296 US$ | 1.642 US$ | #58 |
| 1965 | 305 US$ | 1.738 US$ | #56 |
| 1964 | 297,3 US$ | 1.722 US$ | #54 |
| 1963 | 353 US$ | 1.895 US$ | #43 |
| 1962 | 282,3 US$ | 1.708 US$ | #53 |
| 1961 | 281,7 US$ | 1.743 US$ | #48 |
| 1960 | 238,3 US$ | 1.419 US$ | #57 |
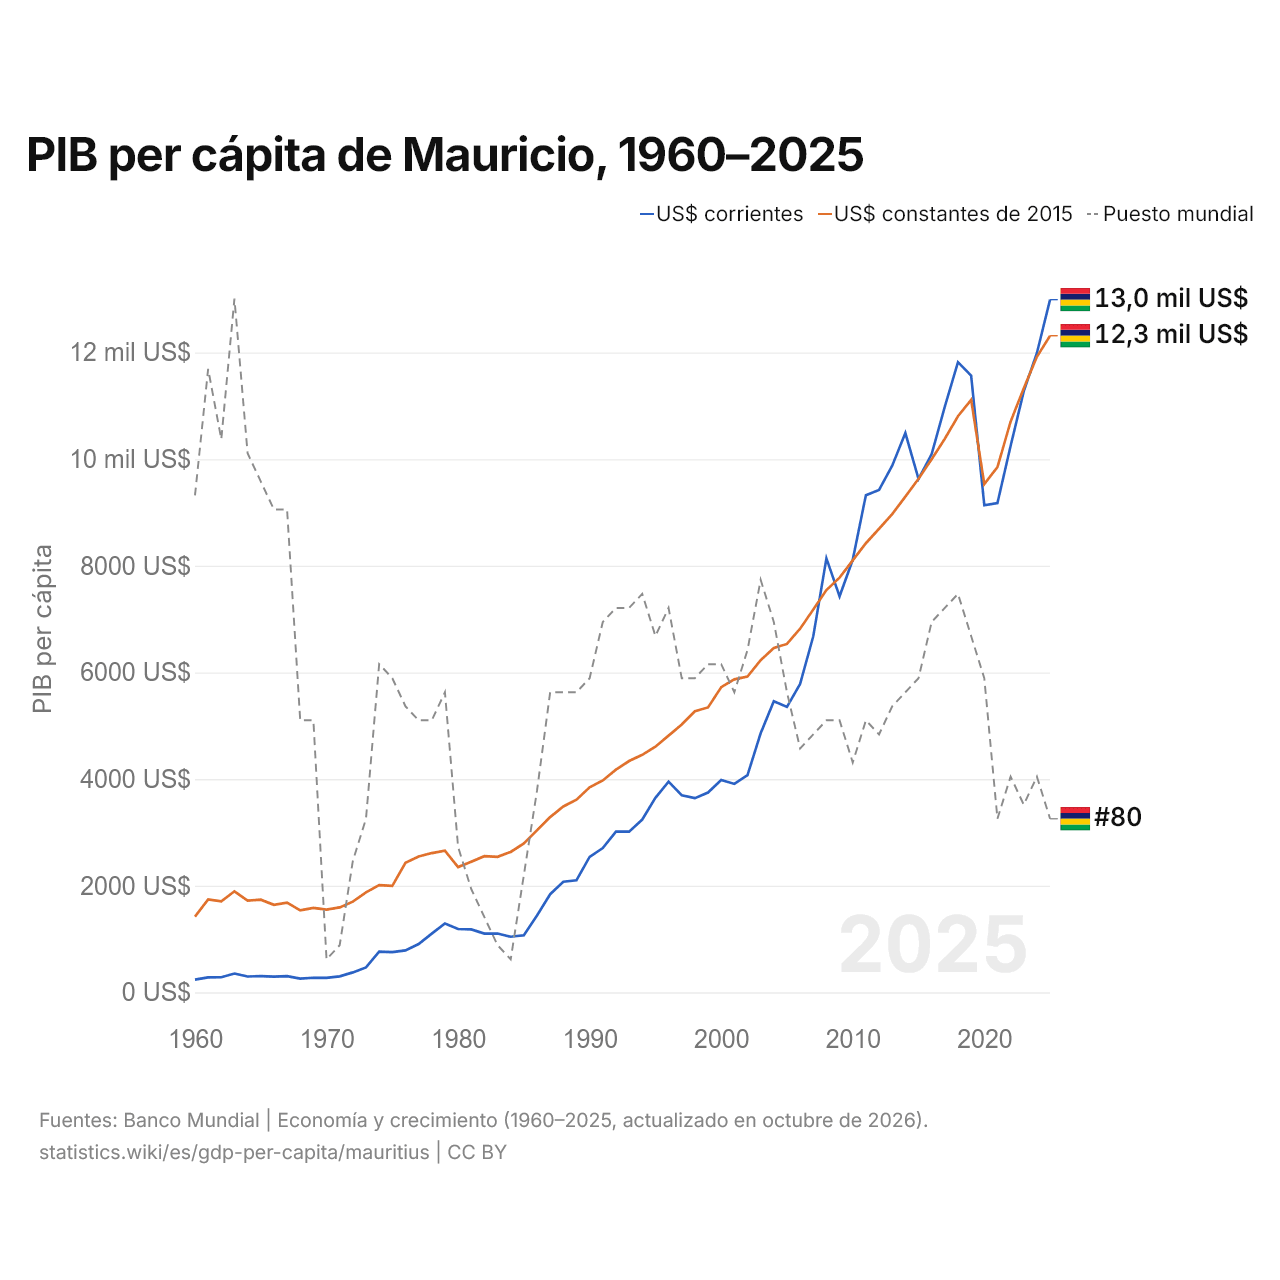
En 2025, el PIB per cápita de Mauricio fue de 12.991 US$, más que los 238 US$ de 1960. El de Mauricio era similar al PIB per cápita mundial, de 14.406 US$. Ocupó el puesto 80 del mundo; en 2024, el 77. Su mejor posición fue el puesto 43, por última vez en 1963. A precios constantes de 2015, el PIB per cápita creció un 3,3 % en 2025 y un 27,9 % en los diez años desde 2015.
A precios constantes de 2015, el PIB per cápita de Mauricio en 2025 fue 8,7 veces el de 1960, con un crecimiento medio del 3,4 % anual. Desde 1960, por décadas, el PIB per cápita de Mauricio creció más rápido de 1980 a 1990, un 5,1 % anual, y más lento de 1960 a 1970, un 0,9 % anual.
El PIB per cápita de Mauricio fue el 2.º más alto de los 54 países de África, donde iba desde 234 US$ en Burundi hasta 19.449 US$ en Seychelles. El PIB per cápita (PPA) de Mauricio fue de 33.667 dólares en 2025, el puesto 71 del mundo.
Mauricio en la clasificación mundial del PIB per cápita, 2025
| Puesto | País | PIB per cápita | × media mundial | |
|---|---|---|---|---|
| 77 |
 China |
13.862 US$ | 0,96× | |
| 78 |
 Malasia |
13.125 US$ | 0,91× | |
| 79 |
 Albania |
12.998 US$ | 0,9× | |
| 80 |
 Mauricio |
12.991 US$ | 0,9× | |
| 81 |
 San Vicente [...] |
12.562 US$ | 0,87× | |
| 82 |
 Granada |
12.107 US$ | 0,84× | |
| 83 |
 República [...] |
11.059 US$ | 0,77× |
Comparar el PIB per cápita de Mauricio con otros países
Fuentes:
- Banco Mundial | Economía y crecimiento (1960–2025, actualizado en octubre de 2026)
Creative Commons Atribución (CC BY): puedes copiar, compartir, adaptar y reutilizar este contenido, también con fines comerciales, siempre que cites a statistics.wiki e indiques los cambios que hayas hecho. Las fuentes indicadas arriba pueden tener sus propias condiciones de licencia.