
PIB per cápita de Nepal, 1960–2025
| Año | PIB per cápita | Puesto mundial | |
|---|---|---|---|
| US$ corrientes | US$ constantes de 2015 | ||
| 2025 | 1.536 US$ | 1.234 US$ | #165 |
| 2024 | 1.460 US$ | 1.180 US$ | #163 |
| 2023 | 1.382 US$ | 1.136 US$ | #164 |
| 2022 | 1.386 US$ | 1.114 US$ | #165 |
| 2021 | 1.253 US$ | 1.063 US$ | #164 |
| 2020 | 1.154 US$ | 1.032 US$ | #165 |
| 2019 | 1.203 US$ | 1.077 US$ | #165 |
| 2018 | 1.179 US$ | 1.022 US$ | #165 |
| 2017 | 1.034 US$ | 952 US$ | #169 |
| 2016 | 877 US$ | 875 US$ | #172 |
| 2015 | 876 US$ | 876 US$ | #175 |
| 2014 | 821 US$ | 847 US$ | #179 |
| 2013 | 803 US$ | 801 US$ | #179 |
| 2012 | 788 US$ | 775 US$ | #179 |
| 2011 | 786 US$ | 743 US$ | #177 |
| 2010 | 585 US$ | 721 US$ | #185 |
| 2009 | 473 US$ | 692 US$ | #187 |
| 2008 | 465 US$ | 667 US$ | #188 |
| 2007 | 385 US$ | 633 US$ | #188 |
| 2006 | 340 US$ | 617 US$ | #185 |
| 2005 | 309 US$ | 603 US$ | #186 |
| 2004 | 279,6 US$ | 589 US$ | #186 |
| 2003 | 246,4 US$ | 570 US$ | #186 |
| 2002 | 238,9 US$ | 556 US$ | #183 |
| 2001 | 240,8 US$ | 564 US$ | #181 |
| 2000 | 223,8 US$ | 547 US$ | #185 |
| 1999 | 208,6 US$ | 524 US$ | #183 |
| 1998 | 205,1 US$ | 512 US$ | #185 |
| 1997 | 211,8 US$ | 506 US$ | #183 |
| 1996 | 198,8 US$ | 492 US$ | #183 |
| 1995 | 197,8 US$ | 478 US$ | #183 |
| 1994 | 187,3 US$ | 473 US$ | #175 |
| 1993 | 172,8 US$ | 448 US$ | #179 |
| 1992 | 165 US$ | 443 US$ | #176 |
| 1991 | 195,7 US$ | 438 US$ | #175 |
| 1990 | 185,8 US$ | 423 US$ | #176 |
| 1989 | 185 US$ | 414 US$ | #162 |
| 1988 | 187,1 US$ | 406 US$ | #163 |
| 1987 | 162 US$ | 385 US$ | #161 |
| 1986 | 159,5 US$ | 386 US$ | #156 |
| 1985 | 149,9 US$ | 378 US$ | #157 |
| 1984 | 151,1 US$ | 364 US$ | #154 |
| 1983 | 146,6 US$ | 340 US$ | #153 |
| 1982 | 147 US$ | 359 US$ | #153 |
| 1981 | 142,9 US$ | 354 US$ | #152 |
| 1980 | 125,1 US$ | 334 US$ | #153 |
| 1979 | 121,9 US$ | 350 US$ | #145 |
| 1978 | 108,1 US$ | 350 US$ | #145 |
| 1977 | 95,3 US$ | 343 US$ | #145 |
| 1976 | 102,5 US$ | 341 US$ | #142 |
| 1975 | 113,6 US$ | 334 US$ | #141 |
| 1974 | 89,8 US$ | 336 US$ | #137 |
| 1973 | 73,2 US$ | 323 US$ | #138 |
| 1972 | 78,8 US$ | 332 US$ | #134 |
| 1971 | 69,5 US$ | 329 US$ | #137 |
| 1970 | 69,6 US$ | 340 US$ | #135 |
| 1969 | 64,8 US$ | 339 US$ | #117 |
| 1968 | 64,9 US$ | 332 US$ | #115 |
| 1967 | 72,3 US$ | 337 US$ | #114 |
| 1966 | 79,5 US$ | 349 US$ | #112 |
| 1965 | 65,8 US$ | 333 US$ | #112 |
| 1964 | 45,3 US$ | 344 US$ | #111 |
| 1963 | 46,3 US$ | 327 US$ | #111 |
| 1962 | 54,6 US$ | 327 US$ | #110 |
| 1961 | 51,6 US$ | 327 US$ | #108 |
| 1960 | 50,2 US$ | 327 US$ | #106 |
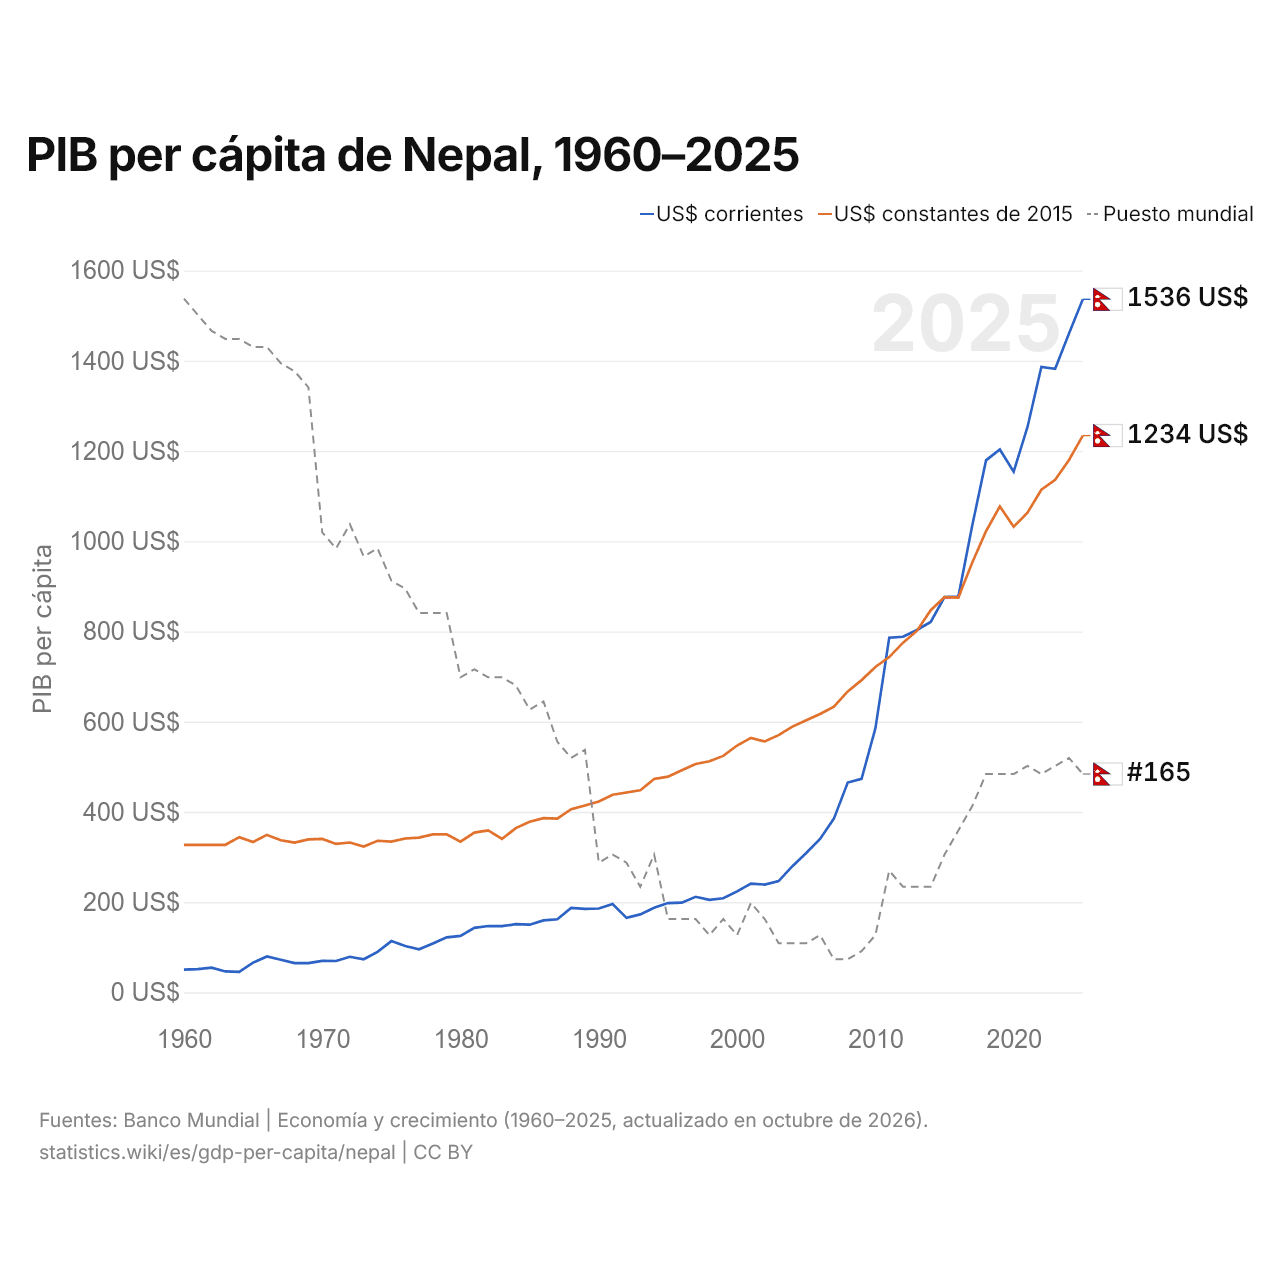
En 2025, el PIB per cápita de Nepal fue de 1536 US$, más que los 50 US$ de 1960. El de Nepal equivalía al 11 % del PIB per cápita mundial, de 14.406 US$. Su mínimo fue de 45 US$, en 1964. Ocupó el puesto 165 del mundo; en 2024, el 163. Su mejor posición fue el puesto 106, por última vez en 1960. A precios constantes de 2015, el PIB per cápita creció un 4,5 % en 2025 y un 40,9 % en los diez años desde 2015.
A precios constantes de 2015, el PIB per cápita de Nepal en 2025 fue 3,8 veces el de 1960, con un crecimiento medio del 2,1 % anual. Desde 1960, por décadas, el PIB per cápita de Nepal creció más rápido de 2010 a 2020, un 3,6 % anual, y más lento de 1970 a 1980, cuando cayó un 0,2 % anual.
El PIB per cápita de Nepal fue el 42.º más alto de los 48 países de Asia, donde iba desde 417 US$ en Afganistán (2024) hasta 98.814 US$ en Singapur. El PIB per cápita (PPA) de Nepal fue de 6175 dólares en 2025, el puesto 154 del mundo.
Nepal en la clasificación mundial del PIB per cápita, 2025
| Puesto | País | PIB per cápita | × media mundial | |
|---|---|---|---|---|
| 162 |
 Benín |
1658 US$ | 0,12× | |
| 163 |
 Tayikistán |
1637 US$ | 0,11× | |
| 164 |
 Pakistán |
1596 US$ | 0,11× | vs Pakistán |
| 165 |
 Nepal |
1536 US$ | 0,11× | |
| 166 |
 Birmania |
1489 US$ | 0,1× | vs Birmania |
| 167 |
 Togo |
1384 US$ | 0,1× | |
| 168 |
 Timor Oriental |
1341 US$ | 0,09× |
Comparar el PIB per cápita de Nepal con otros países
Fuentes:
- Banco Mundial | Economía y crecimiento (1960–2025, actualizado en octubre de 2026)
Creative Commons Atribución (CC BY): puedes copiar, compartir, adaptar y reutilizar este contenido, también con fines comerciales, siempre que cites a statistics.wiki e indiques los cambios que hayas hecho. Las fuentes indicadas arriba pueden tener sus propias condiciones de licencia.