
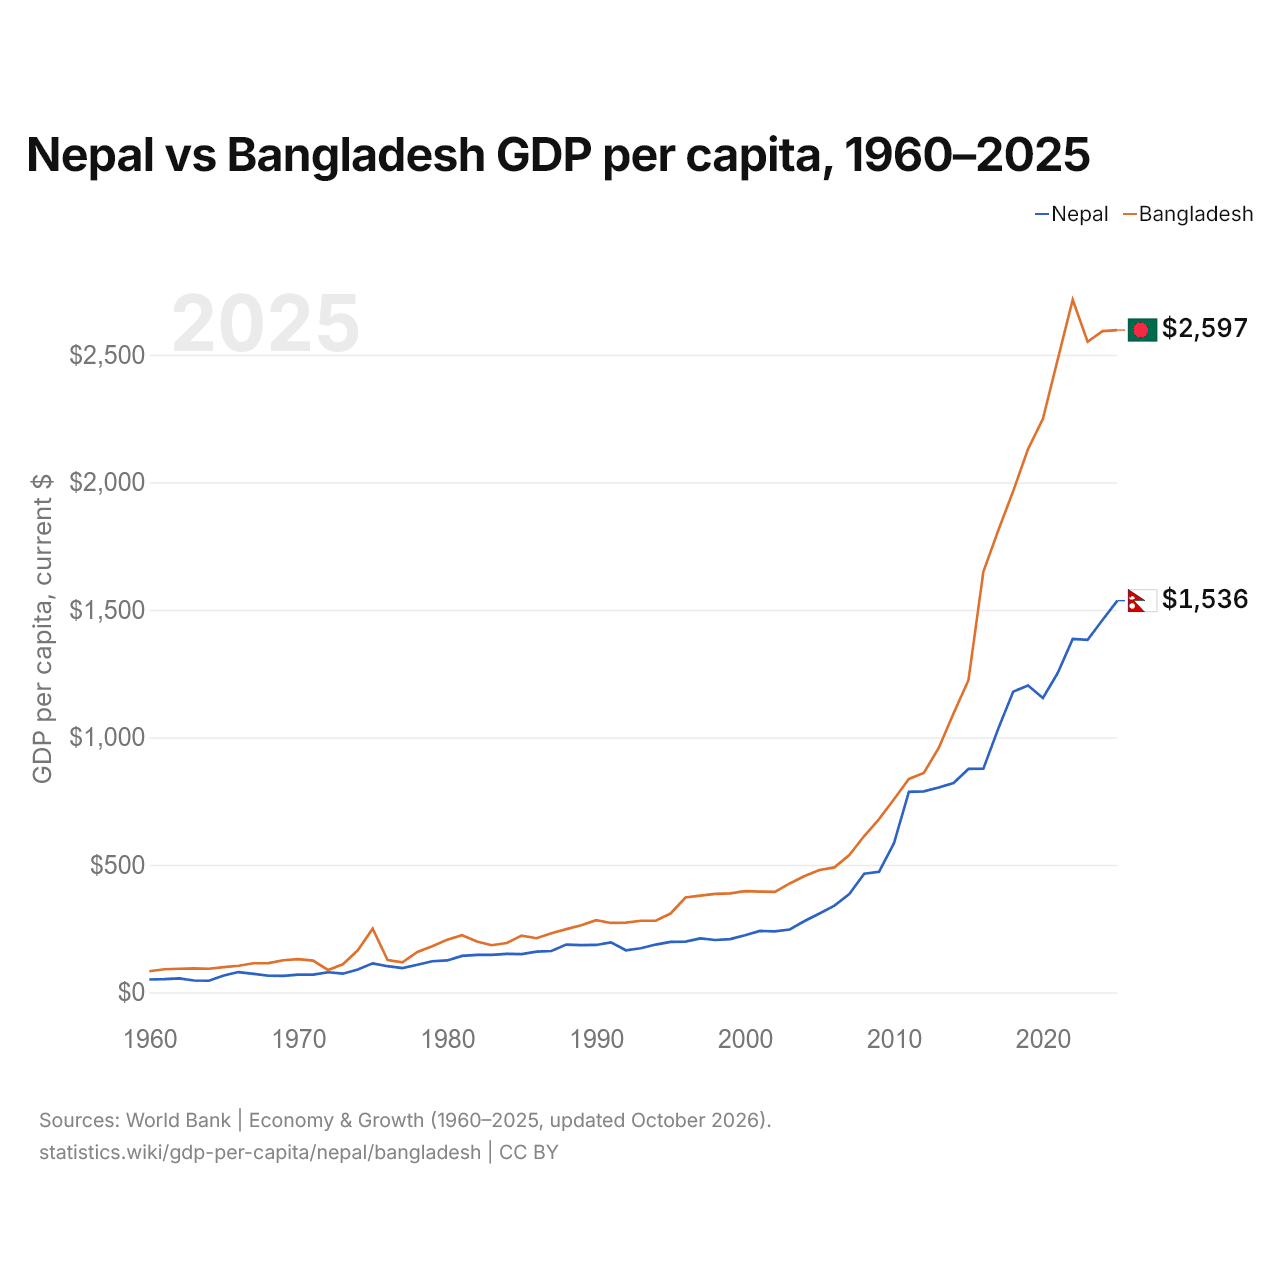
Nepal vs Bangladés: PIB per cápita, 1960–2025
| Año | PIB per cápita, US$ corrientes | |
|---|---|---|
 Nepal |
 Bangladés |
|
| 2025 | 1.536 US$ | 2.597 US$ |
| 2024 | 1.460 US$ | 2.593 US$ |
| 2023 | 1.382 US$ | 2.551 US$ |
| 2022 | 1.386 US$ | 2.716 US$ |
| 2021 | 1.253 US$ | 2.483 US$ |
| 2020 | 1.154 US$ | 2.249 US$ |
| 2019 | 1.203 US$ | 2.130 US$ |
| 2018 | 1.179 US$ | 1.965 US$ |
| 2017 | 1.034 US$ | 1.811 US$ |
| 2016 | 877 US$ | 1.649 US$ |
| 2015 | 876 US$ | 1.224 US$ |
| 2014 | 821 US$ | 1.094 US$ |
| 2013 | 803 US$ | 958 US$ |
| 2012 | 788 US$ | 860 US$ |
| 2011 | 786 US$ | 837 US$ |
| 2010 | 585 US$ | 757 US$ |
| 2009 | 473 US$ | 679 US$ |
| 2008 | 465 US$ | 613 US$ |
| 2007 | 385 US$ | 538 US$ |
| 2006 | 340 US$ | 490 US$ |
| 2005 | 309 US$ | 480 US$ |
| 2004 | 279,6 US$ | 456 US$ |
| 2003 | 246,4 US$ | 427 US$ |
| 2002 | 238,9 US$ | 394 US$ |
| 2001 | 240,8 US$ | 395 US$ |
| 2000 | 223,8 US$ | 397 US$ |
| 1999 | 208,6 US$ | 388 US$ |
| 1998 | 205,1 US$ | 386 US$ |
| 1997 | 211,8 US$ | 379 US$ |
| 1996 | 198,8 US$ | 372 US$ |
| 1995 | 197,8 US$ | 309 US$ |
| 1994 | 187,3 US$ | 280,6 US$ |
| 1993 | 172,8 US$ | 280,8 US$ |
| 1992 | 165 US$ | 273,5 US$ |
| 1991 | 195,7 US$ | 272,1 US$ |
| 1990 | 185,8 US$ | 283,1 US$ |
| 1989 | 185 US$ | 263 US$ |
| 1988 | 187,1 US$ | 247,9 US$ |
| 1987 | 162 US$ | 231,5 US$ |
| 1986 | 159,5 US$ | 212,1 US$ |
| 1985 | 149,9 US$ | 222,2 US$ |
| 1984 | 151,1 US$ | 193,4 US$ |
| 1983 | 146,6 US$ | 184,7 US$ |
| 1982 | 147 US$ | 199,6 US$ |
| 1981 | 142,9 US$ | 224,2 US$ |
| 1980 | 125,1 US$ | 206,1 US$ |
| 1979 | 121,9 US$ | 181,1 US$ |
| 1978 | 108,1 US$ | 158,3 US$ |
| 1977 | 95,3 US$ | 117,9 US$ |
| 1976 | 102,5 US$ | 126,7 US$ |
| 1975 | 113,6 US$ | 249,8 US$ |
| 1974 | 89,8 US$ | 165 US$ |
| 1973 | 73,2 US$ | 109,7 US$ |
| 1972 | 78,8 US$ | 87,8 US$ |
| 1971 | 69,5 US$ | 124,5 US$ |
| 1970 | 69,6 US$ | 130,2 US$ |
| 1969 | 64,8 US$ | 125,9 US$ |
| 1968 | 64,9 US$ | 114,4 US$ |
| 1967 | 72,3 US$ | 114,2 US$ |
| 1966 | 79,5 US$ | 104,4 US$ |
| 1965 | 65,8 US$ | 98,6 US$ |
| 1964 | 45,3 US$ | 92,6 US$ |
| 1963 | 46,3 US$ | 94,1 US$ |
| 1962 | 54,6 US$ | 92,6 US$ |
| 1961 | 51,6 US$ | 90,4 US$ |
| 1960 | 50,2 US$ | 82,5 US$ |
En 2025, el PIB per cápita fue de 1536 US$ en Nepal y de 2597 US$ en Bangladés: 1,7 veces más alto en Bangladés. En 1960 era de 50 US$ en Nepal y de 82 US$ en Bangladés, 1,6 veces más alto en Bangladés.
El PIB per cápita de Bangladés ha sido más alto que el de Nepal todos los años desde 1960. A precios constantes de 2015, el PIB per cápita de Nepal en 2025 fue 3,8 veces el de 1960, y el de Bangladés, 4,6 veces.
Nepal vs Bangladés: últimos datos del PIB per cápita
Comparar el PIB per cápita de 2 países cualesquiera
Fuentes:
- Banco Mundial | Economía y crecimiento (1960–2025, actualizado en octubre de 2026)
Creative Commons Atribución (CC BY): puedes copiar, compartir, adaptar y reutilizar este contenido, también con fines comerciales, siempre que cites a statistics.wiki e indiques los cambios que hayas hecho. Las fuentes indicadas arriba pueden tener sus propias condiciones de licencia.