
PIB per cápita de Irlanda, 1960–2025
| Año | PIB per cápita | Puesto mundial | |
|---|---|---|---|
| US$ corrientes | US$ constantes de 2015 | ||
| 2025 | 131.592 US$ | 104.417 US$ | #4 |
| 2024 | 112.895 US$ | 94.475 US$ | #4 |
| 2023 | 106.819 US$ | 93.542 US$ | #4 |
| 2022 | 105.191 US$ | 97.794 US$ | #5 |
| 2021 | 103.783 US$ | 92.781 US$ | #4 |
| 2020 | 86.514 US$ | 80.928 US$ | #5 |
| 2019 | 81.828 US$ | 76.486 US$ | #6 |
| 2018 | 80.804 US$ | 74.029 US$ | #7 |
| 2017 | 72.161 US$ | 69.749 US$ | #8 |
| 2016 | 64.130 US$ | 64.206 US$ | #7 |
| 2015 | 64.250 US$ | 64.250 US$ | #8 |
| 2014 | 57.215 US$ | 52.045 US$ | #12 |
| 2013 | 52.538 US$ | 47.928 US$ | #16 |
| 2012 | 49.336 US$ | 47.147 US$ | #18 |
| 2011 | 52.614 US$ | 47.540 US$ | #14 |
| 2010 | 48.624 US$ | 46.992 US$ | #14 |
| 2009 | 52.133 US$ | 46.466 US$ | #11 |
| 2008 | 61.353 US$ | 49.461 US$ | #10 |
| 2007 | 61.396 US$ | 52.850 US$ | #10 |
| 2006 | 54.329 US$ | 51.657 US$ | #10 |
| 2005 | 50.933 US$ | 50.547 US$ | #9 |
| 2004 | 47.754 US$ | 48.856 US$ | #8 |
| 2003 | 41.204 US$ | 46.595 US$ | #7 |
| 2002 | 32.705 US$ | 45.974 US$ | #11 |
| 2001 | 28.282 US$ | 44.151 US$ | #11 |
| 2000 | 26.335 US$ | 42.599 US$ | #15 |
| 1999 | 26.338 US$ | 39.460 US$ | #16 |
| 1998 | 24.295 US$ | 36.106 US$ | #20 |
| 1997 | 22.551 US$ | 33.544 US$ | #23 |
| 1996 | 20.836 US$ | 30.518 US$ | #24 |
| 1995 | 19.158 US$ | 28.647 US$ | #24 |
| 1994 | 15.903 US$ | 26.264 US$ | #25 |
| 1993 | 14.657 US$ | 24.932 US$ | #27 |
| 1992 | 15.714 US$ | 24.400 US$ | #27 |
| 1991 | 14.087 US$ | 23.773 US$ | #28 |
| 1990 | 14.031 US$ | 23.457 US$ | #25 |
| 1989 | 11.176 US$ | 21.644 US$ | #28 |
| 1988 | 10.716 US$ | 20.374 US$ | #27 |
| 1987 | 9.582 US$ | 19.281 US$ | #29 |
| 1986 | 8.112 US$ | 18.424 US$ | #30 |
| 1985 | 6.012 US$ | 18.512 US$ | #35 |
| 1984 | 5.692 US$ | 17.986 US$ | #35 |
| 1983 | 5.915 US$ | 17.343 US$ | #35 |
| 1982 | 6.161 US$ | 17.509 US$ | #35 |
| 1981 | 5.986 US$ | 17.281 US$ | #35 |
| 1980 | 6.372 US$ | 16.922 US$ | #31 |
| 1979 | 5.430 US$ | 16.606 US$ | #34 |
| 1978 | 4.400 US$ | 16.327 US$ | #33 |
| 1977 | 3.427 US$ | 15.450 US$ | #35 |
| 1976 | 2.920 US$ | 14.472 US$ | #37 |
| 1975 | 2.973 US$ | 14.490 US$ | #35 |
| 1974 | 2.517 US$ | 13.942 US$ | #36 |
| 1973 | 2.424 US$ | 13.596 US$ | #34 |
| 1972 | 2.080 US$ | 13.193 US$ | #32 |
| 1971 | 1.704 US$ | 12.574 US$ | #32 |
| 1970 | 1.487 US$ | 12.296 US$ | #32 |
| 1969 | 1.331 US$ | 12.077 US$ | #24 |
| 1968 | 1.159 US$ | 11.475 US$ | #26 |
| 1967 | 1.187 US$ | 10.649 US$ | #24 |
| 1966 | 1.107 US$ | 10.114 US$ | #26 |
| 1965 | 1.055 US$ | 10.065 US$ | #23 |
| 1964 | 995 US$ | 9.911 US$ | #23 |
| 1963 | 878 US$ | 9.596 US$ | #23 |
| 1962 | 821 US$ | 9.215 US$ | #24 |
| 1961 | 762 US$ | 8.965 US$ | #23 |
| 1960 | 707 US$ | 8.524 US$ | #24 |
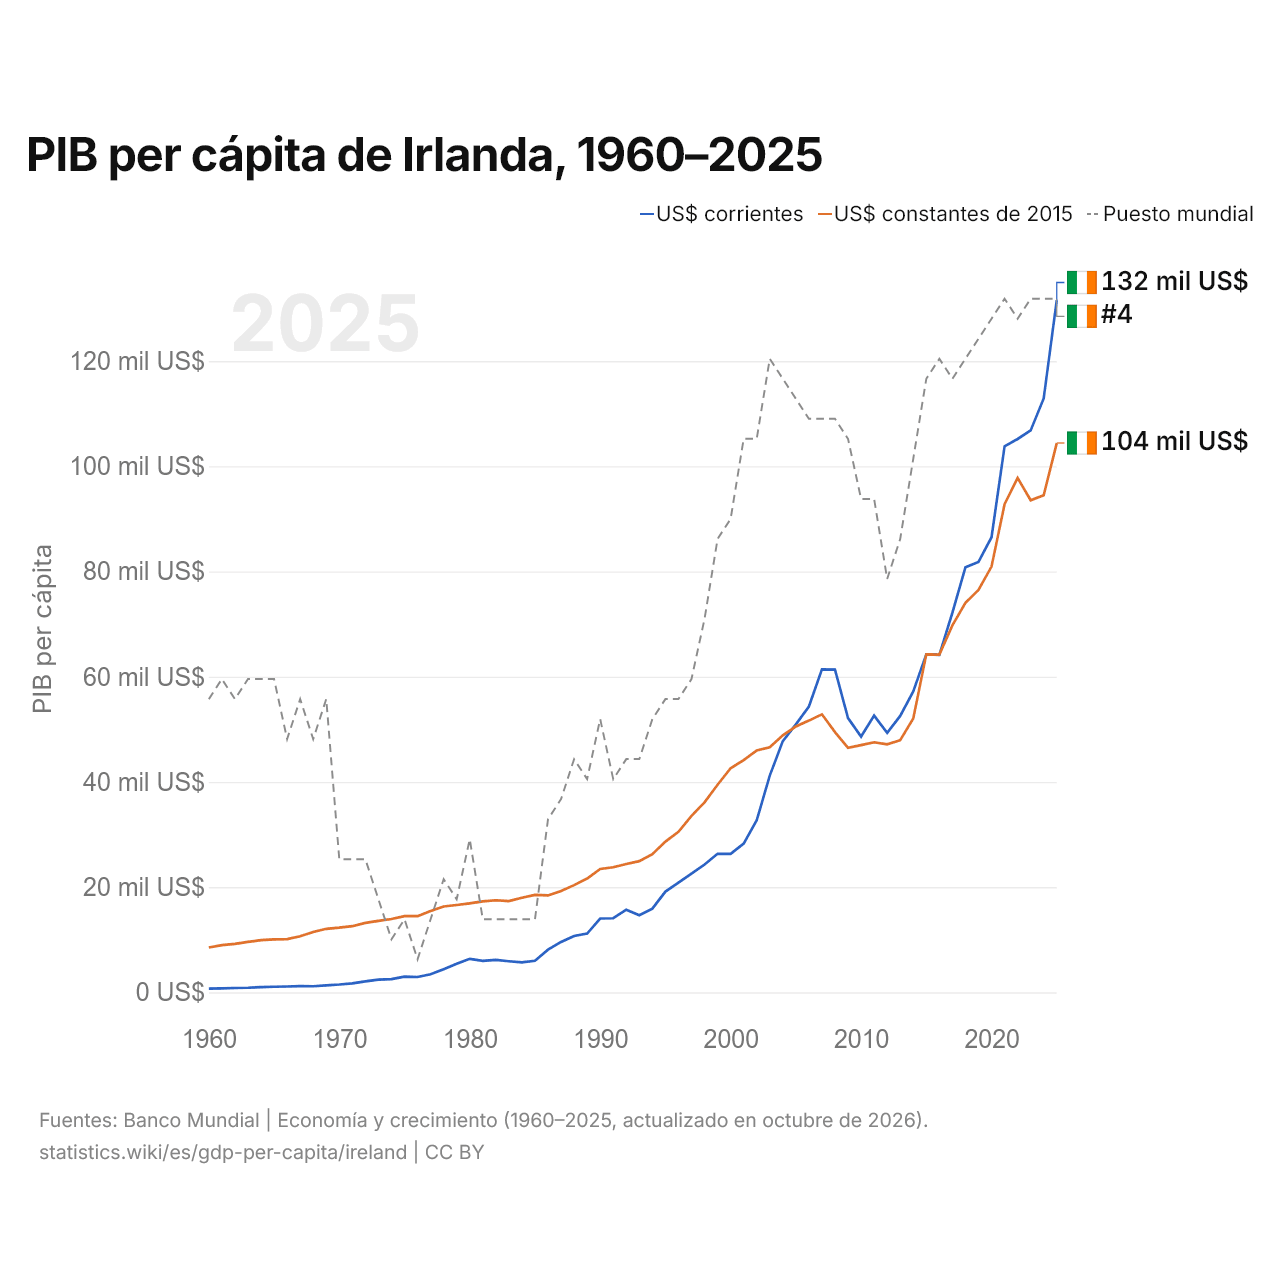
En 2025, el PIB per cápita de Irlanda fue de 131.592 US$, más que los 707 US$ de 1960. El de Irlanda equivalía a 9,1 veces el PIB per cápita mundial, de 14.406 US$. Ocupó el puesto 4 del mundo, que mantiene desde 2023. A precios constantes de 2015, el PIB per cápita creció un 10,5 % en 2025 y un 62,5 % en los diez años desde 2015.
A precios constantes de 2015, el PIB per cápita de Irlanda en 2025 fue 12 veces el de 1960, con un crecimiento medio del 3,9 % anual. Desde 1960, por décadas, el PIB per cápita de Irlanda creció más rápido de 1990 a 2000, un 6,1 % anual, y más lento de 2000 a 2010, un 1,0 % anual.
El PIB per cápita de Irlanda fue el 4.º más alto de los 45 países de Europa, donde iba desde 5496 US$ en Ucrania hasta 288.002 US$ en Mónaco (2024). El PIB per cápita (PPA) de Irlanda fue de 155.089 dólares en 2025, el puesto 3 del mundo.
Irlanda en la clasificación mundial del PIB per cápita, 2025
| Puesto | País | PIB per cápita | × media mundial | |
|---|---|---|---|---|
| 1 |
 Mónaco |
288.002 US$ (2024) | 21× | |
| 2 |
 Liechtenstein |
220.167 US$ (2024) | 16,1× | |
| 3 |
 Luxemburgo |
147.252 US$ | 10,2× | |
| 4 |
 Irlanda |
131.592 US$ | 9,13× | |
| 5 |
 Suiza |
114.769 US$ | 7,97× | vs Suiza |
| 6 |
 Islas Caimán |
104.293 US$ (2024) | 7,6× | |
| 7 |
 Singapur |
98.814 US$ | 6,86× |
Comparar el PIB per cápita de Irlanda con otros países
Fuentes:
- Banco Mundial | Economía y crecimiento (1960–2025, actualizado en octubre de 2026)
Creative Commons Atribución (CC BY): puedes copiar, compartir, adaptar y reutilizar este contenido, también con fines comerciales, siempre que cites a statistics.wiki e indiques los cambios que hayas hecho. Las fuentes indicadas arriba pueden tener sus propias condiciones de licencia.