
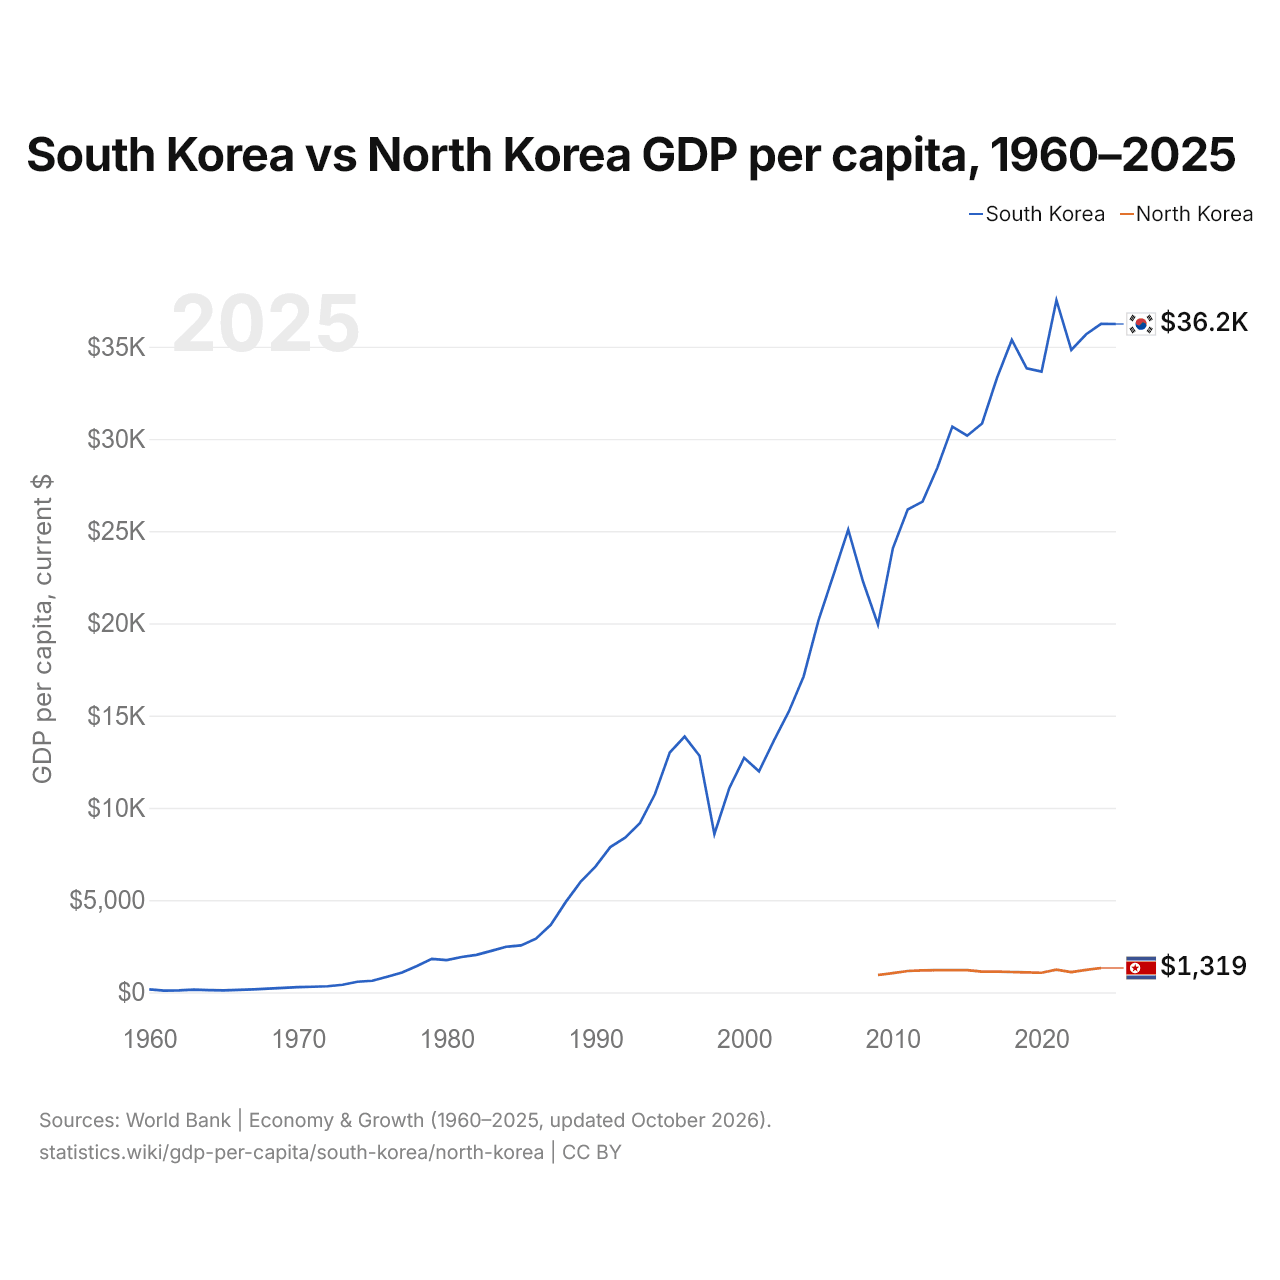
Corea del Sur vs Corea del Norte: PIB per cápita, 1960–2025
1x
| Año | PIB per cápita, US$ corrientes | |
|---|---|---|
 Corea del Sur |
 Corea del Norte |
|
| 2025 | 36.227 US$ | - |
| 2024 | 36.239 US$ | 1.319 US$ |
| 2023 | 35.674 US$ | 1.217 US$ |
| 2022 | 34.822 US$ | 1.100 US$ |
| 2021 | 37.518 US$ | 1.231 US$ |
| 2020 | 33.646 US$ | 1.061 US$ |
| 2019 | 33.827 US$ | 1.084 US$ |
| 2018 | 35.364 US$ | 1.100 US$ |
| 2017 | 33.297 US$ | 1.127 US$ |
| 2016 | 30.832 US$ | 1.124 US$ |
| 2015 | 30.172 US$ | 1.201 US$ |
| 2014 | 30.667 US$ | 1.201 US$ |
| 2013 | 28.449 US$ | 1.208 US$ |
| 2012 | 26.601 US$ | 1.186 US$ |
| 2011 | 26.175 US$ | 1.156 US$ |
| 2010 | 24.071 US$ | 1.040 US$ |
| 2009 | 19.937 US$ | 939 US$ |
| 2008 | 22.252 US$ | - |
| 2007 | 25.078 US$ | - |
| 2006 | 22.610 US$ | - |
| 2005 | 20.167 US$ | - |
| 2004 | 17.122 US$ | - |
| 2003 | 15.212 US$ | - |
| 2002 | 13.643 US$ | - |
| 2001 | 11.981 US$ | - |
| 2000 | 12.710 US$ | - |
| 1999 | 11.063 US$ | - |
| 1998 | 8.583 US$ | - |
| 1997 | 12.822 US$ | - |
| 1996 | 13.865 US$ | - |
| 1995 | 13.002 US$ | - |
| 1994 | 10.734 US$ | - |
| 1993 | 9.180 US$ | - |
| 1992 | 8.387 US$ | - |
| 1991 | 7.873 US$ | - |
| 1990 | 6.813 US$ | - |
| 1989 | 5.989 US$ | - |
| 1988 | 4.889 US$ | - |
| 1987 | 3.658 US$ | - |
| 1986 | 2.911 US$ | - |
| 1985 | 2.543 US$ | - |
| 1984 | 2.469 US$ | - |
| 1983 | 2.246 US$ | - |
| 1982 | 2.032 US$ | - |
| 1981 | 1.918 US$ | - |
| 1980 | 1.746 US$ | - |
| 1979 | 1.814 US$ | - |
| 1978 | 1.429 US$ | - |
| 1977 | 1.073 US$ | - |
| 1976 | 847 US$ | - |
| 1975 | 627 US$ | - |
| 1974 | 572 US$ | - |
| 1973 | 412 US$ | - |
| 1972 | 328 US$ | - |
| 1971 | 304 US$ | - |
| 1970 | 281,8 US$ | - |
| 1969 | 245,5 US$ | - |
| 1968 | 200 US$ | - |
| 1967 | 162,5 US$ | - |
| 1966 | 134,4 US$ | - |
| 1965 | 109,4 US$ | - |
| 1964 | 124,2 US$ | - |
| 1963 | 147 US$ | - |
| 1962 | 106,6 US$ | - |
| 1961 | 94,2 US$ | - |
| 1960 | 158,8 US$ | - |
El PIB per cápita fue de 36.239 US$ en Corea del Sur (2024) y de 1319 US$ en Corea del Norte (2024): 27 veces más alto en Corea del Sur. En 2009 era de 19.937 US$ en Corea del Sur y de 939 US$ en Corea del Norte, 21 veces más alto en Corea del Sur.
El PIB per cápita de Corea del Sur ha sido más alto que el de Corea del Norte todos los años desde 2009.
Corea del Sur vs Corea del Norte: últimos datos del PIB per cápita
|
Corea del Sur
|
Corea del Norte
|
|
|---|---|---|
| PIB per cápita, US$ corrientes | 36.227 US$ (2025) | 1319 US$ (2024) |
| Puesto mundial | 34/197 | 169/197 |
| × media mundial | 2,51× | 0,1× |
Comparar el PIB per cápita de 2 países cualesquiera
Fuentes:
- Banco Mundial | Economía y crecimiento (1960–2025, actualizado en octubre de 2026)
Creative Commons Atribución (CC BY): puedes copiar, compartir, adaptar y reutilizar este contenido, también con fines comerciales, siempre que cites a statistics.wiki e indiques los cambios que hayas hecho. Las fuentes indicadas arriba pueden tener sus propias condiciones de licencia.