
México vs Baréin: PIB per cápita, 1960–2025
| Año | PIB per cápita, US$ corrientes | |
|---|---|---|
 México |
 Baréin |
|
| 2025 | 13.889 US$ | 30.597 US$ |
| 2024 | 13.988 US$ | 29.717 US$ |
| 2023 | 13.831 US$ | 29.290 US$ |
| 2022 | 11.406 US$ | 30.471 US$ |
| 2021 | 10.314 US$ | 27.148 US$ |
| 2020 | 8.841 US$ | 24.343 US$ |
| 2019 | 10.370 US$ | 27.260 US$ |
| 2018 | 10.085 US$ | 26.324 US$ |
| 2017 | 9.649 US$ | 24.785 US$ |
| 2016 | 9.098 US$ | 23.800 US$ |
| 2015 | 10.021 US$ | 23.734 US$ |
| 2014 | 11.391 US$ | 26.452 US$ |
| 2013 | 11.217 US$ | 26.990 US$ |
| 2012 | 10.744 US$ | 26.439 US$ |
| 2011 | 10.664 US$ | 25.033 US$ |
| 2010 | 9.729 US$ | 21.819 US$ |
| 2009 | 8.424 US$ | 19.465 US$ |
| 2008 | 10.524 US$ | 23.299 US$ |
| 2007 | 10.134 US$ | 20.908 US$ |
| 2006 | 9.513 US$ | 19.267 US$ |
| 2005 | 8.672 US$ | 17.966 US$ |
| 2004 | 7.850 US$ | 15.964 US$ |
| 2003 | 7.434 US$ | 14.486 US$ |
| 2002 | 7.983 US$ | 13.501 US$ |
| 2001 | 7.953 US$ | 13.573 US$ |
| 2000 | 7.524 US$ | 14.214 US$ |
| 1999 | 6.500 US$ | 12.123 US$ |
| 1998 | 5.833 US$ | 11.625 US$ |
| 1997 | 5.567 US$ | 12.255 US$ |
| 1996 | 4.674 US$ | 12.092 US$ |
| 1995 | 4.184 US$ | 11.901 US$ |
| 1994 | 6.202 US$ | 11.629 US$ |
| 1993 | 6.048 US$ | 11.152 US$ |
| 1992 | 4.221 US$ | 10.460 US$ |
| 1991 | 3.709 US$ | 10.434 US$ |
| 1990 | 3.154 US$ | 9.343 US$ |
| 1989 | 2.725 US$ | 8.833 US$ |
| 1988 | 2.279 US$ | 8.772 US$ |
| 1987 | 1.888 US$ | 8.333 US$ |
| 1986 | 1.757 US$ | 7.777 US$ |
| 1985 | 2.602 US$ | 9.649 US$ |
| 1984 | 2.506 US$ | 10.697 US$ |
| 1983 | 2.170 US$ | 10.599 US$ |
| 1982 | 2.621 US$ | 10.712 US$ |
| 1981 | 3.829 US$ | 10.557 US$ |
| 1980 | 3.055 US$ | 9.733 US$ |
| 1979 | 2.049 US$ | 7.891 US$ |
| 1978 | 1.604 US$ | 6.926 US$ |
| 1977 | 1.315 US$ | 6.358 US$ |
| 1976 | 1.465 US$ | 5.310 US$ |
| 1975 | 1.492 US$ | 3.880 US$ |
| 1974 | 1.256 US$ | 3.874 US$ |
| 1973 | 993 US$ | 2.981 US$ |
| 1972 | 837 US$ | 2.206 US$ |
| 1971 | 748 US$ | 1.830 US$ |
| 1970 | 699 US$ | 1.742 US$ |
| 1969 | 660 US$ | - |
| 1968 | 616 US$ | - |
| 1967 | 576 US$ | - |
| 1966 | 545 US$ | - |
| 1965 | 506 US$ | - |
| 1964 | 481 US$ | - |
| 1963 | 420 US$ | - |
| 1962 | 388 US$ | - |
| 1961 | 374 US$ | - |
| 1960 | 355 US$ | - |
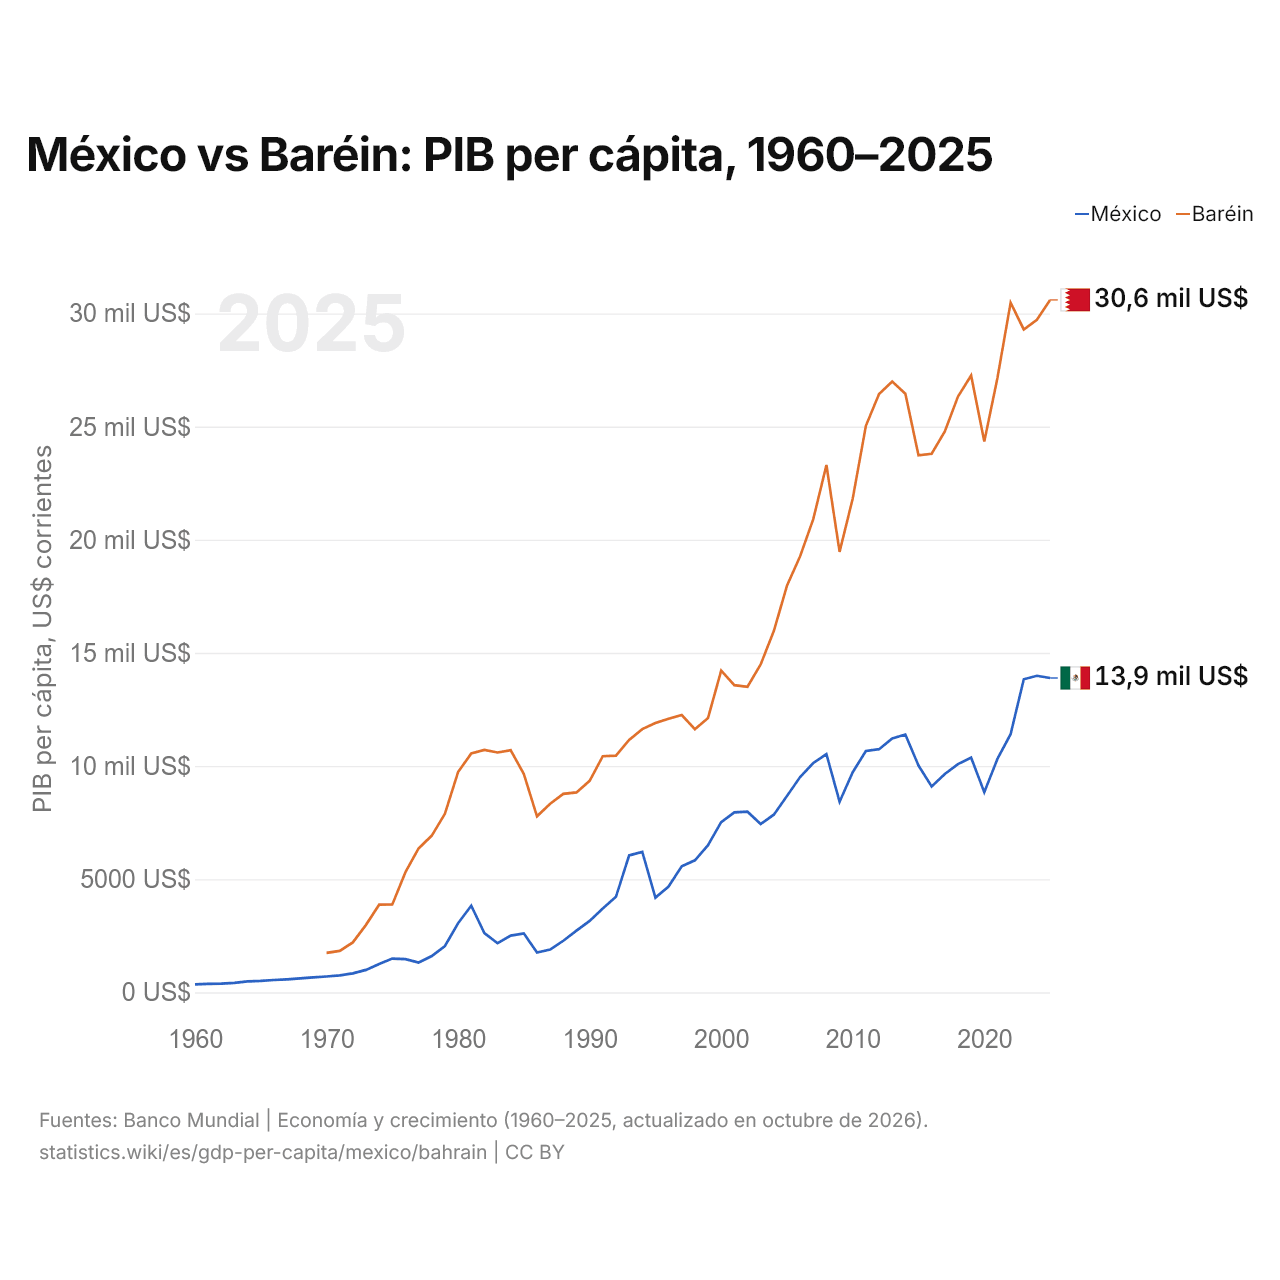
En 2025, el PIB per cápita fue de 13.889 US$ en México y de 30.597 US$ en Baréin: 2,2 veces más alto en Baréin. En 1970 era de 699 US$ en México y de 1742 US$ en Baréin, 2,5 veces más alto en Baréin.
El PIB per cápita de Baréin ha sido más alto que el de México todos los años desde 1970. A precios constantes de 2015, el PIB per cápita de México en 2025 fue 1,8 veces el de 1970, y el de Baréin, 1,5 veces.
México vs Baréin: últimos datos del PIB per cápita
|
México
|
Baréin
|
|
|---|---|---|
| PIB per cápita, US$ corrientes | 13.889 US$ | 30.597 US$ |
| Puesto mundial | 76/197 | 44/197 |
| PIB per cápita, US$ constantes de 2015 | 10.257 US$ | 26.592 US$ |
| × media mundial | 0,96× | 2,12× |
| Diferencia de PIB per cápita | 0,45× | 2,2× |
Comparar el PIB per cápita de 2 países cualesquiera
Fuentes:
- Banco Mundial | Economía y crecimiento (1960–2025, actualizado en octubre de 2026)
Creative Commons Atribución (CC BY): puedes copiar, compartir, adaptar y reutilizar este contenido, también con fines comerciales, siempre que cites a statistics.wiki e indiques los cambios que hayas hecho. Las fuentes indicadas arriba pueden tener sus propias condiciones de licencia.