
Tunisia vs Jordan carbon intensity of GDP (kg CO2 per $, PPP, 2021 prices)
1x
| Year | kg CO2 per $ | |
|---|---|---|
 Tunisia |
 Jordan |
|
| 2024 | 0.205 kg | 0.2 kg |
| 2023 | 0.202 kg | 0.204 kg |
| 2022 | 0.197 kg | 0.204 kg |
| 2021 | 0.207 kg | 0.195 kg |
| 2020 | 0.201 kg | 0.195 kg |
| 2019 | 0.192 kg | 0.215 kg |
| 2018 | 0.195 kg | 0.237 kg |
| 2017 | 0.201 kg | 0.254 kg |
| 2016 | 0.202 kg | 0.247 kg |
| 2015 | 0.21 kg | 0.257 kg |
| 2014 | 0.209 kg | 0.265 kg |
| 2013 | 0.201 kg | 0.255 kg |
| 2012 | 0.206 kg | 0.267 kg |
| 2011 | 0.2 kg | 0.234 kg |
| 2010 | 0.207 kg | 0.236 kg |
| 2009 | 0.195 kg | 0.248 kg |
| 2008 | 0.201 kg | 0.254 kg |
| 2007 | 0.206 kg | 0.283 kg |
| 2006 | 0.213 kg | 0.295 kg |
| 2005 | 0.217 kg | 0.315 kg |
| 2004 | 0.219 kg | 0.319 kg |
| 2003 | 0.22 kg | 0.322 kg |
| 2002 | 0.232 kg | 0.327 kg |
| 2001 | 0.238 kg | 0.331 kg |
| 2000 | 0.237 kg | 0.348 kg |
| 1999 | 0.237 kg | 0.328 kg |
| 1998 | 0.239 kg | 0.338 kg |
| 1997 | 0.24 kg | 0.343 kg |
| 1996 | 0.245 kg | 0.342 kg |
| 1995 | 0.255 kg | 0.342 kg |
| 1994 | 0.255 kg | 0.341 kg |
| 1993 | 0.262 kg | 0.343 kg |
| 1992 | 0.258 kg | 0.345 kg |
| 1991 | 0.261 kg | 0.333 kg |
| 1990 | 0.263 kg | 0.337 kg |
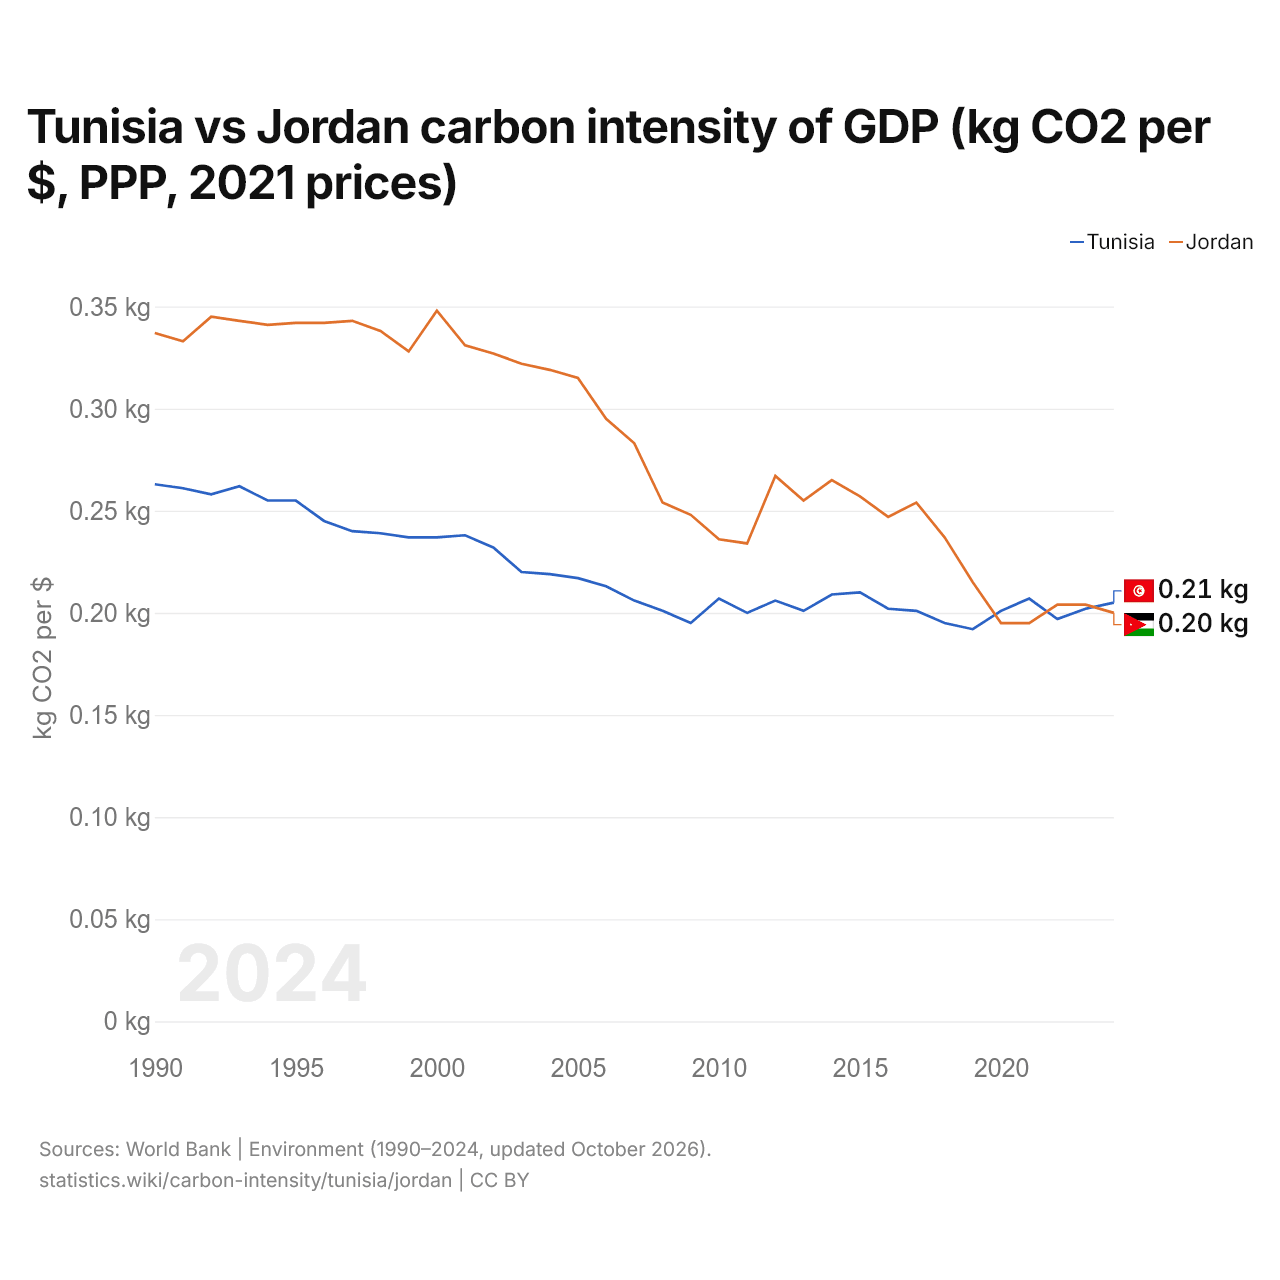
Carbon intensity is 0.205 kg of CO2 per dollar of GDP in Tunisia and 0.200 kg in Jordan: 0.005 kg more in Tunisia. In 1990, Tunisia emitted 0.263 kg and Jordan 0.337 kg, a difference of 0.074 kg.
The gap was widest in 2000, when Jordan's carbon intensity was 0.111 kg above Tunisia's.
Tunisia vs Jordan: latest carbon intensity of GDP
Compare the carbon intensity of GDP of any 2 countries
Sources:
- World Bank | Environment (1990–2024, updated October 2026)
Creative Commons Attribution (CC BY): you may copy, share, adapt and reuse this content, also commercially, as long as you credit statistics.wiki and note any changes you made. The sources listed above may have their own license terms.