
Tunisia vs Lebanon carbon intensity of GDP (kg CO2 per $, PPP, 2021 prices)
1x
| Year | kg CO2 per $ | |
|---|---|---|
 Tunisia |
 Lebanon |
|
| 2024 | 0.205 kg | 0.181 kg |
| 2023 | 0.202 kg | 0.165 kg |
| 2022 | 0.197 kg | 0.158 kg |
| 2021 | 0.207 kg | 0.252 kg |
| 2020 | 0.201 kg | 0.306 kg |
| 2019 | 0.192 kg | 0.298 kg |
| 2018 | 0.195 kg | 0.282 kg |
| 2017 | 0.201 kg | 0.295 kg |
| 2016 | 0.202 kg | 0.283 kg |
| 2015 | 0.21 kg | 0.277 kg |
| 2014 | 0.209 kg | 0.259 kg |
| 2013 | 0.201 kg | 0.245 kg |
| 2012 | 0.206 kg | 0.258 kg |
| 2011 | 0.2 kg | 0.237 kg |
| 2010 | 0.207 kg | 0.236 kg |
| 2009 | 0.195 kg | 0.266 kg |
| 2008 | 0.201 kg | 0.249 kg |
| 2007 | 0.206 kg | 0.221 kg |
| 2006 | 0.213 kg | 0.261 kg |
| 2005 | 0.217 kg | 0.272 kg |
| 2004 | 0.219 kg | 0.282 kg |
| 2003 | 0.22 kg | 0.297 kg |
| 2002 | 0.232 kg | 0.306 kg |
| 2001 | 0.238 kg | 0.318 kg |
| 2000 | 0.237 kg | 0.306 kg |
| 1999 | 0.237 kg | 0.343 kg |
| 1998 | 0.239 kg | 0.331 kg |
| 1997 | 0.24 kg | 0.345 kg |
| 1996 | 0.245 kg | 0.318 kg |
| 1995 | 0.255 kg | 0.341 kg |
| 1994 | 0.255 kg | 0.313 kg |
| 1993 | 0.262 kg | 0.308 kg |
| 1992 | 0.258 kg | 0.238 kg |
| 1991 | 0.261 kg | 0.258 kg |
| 1990 | 0.263 kg | 0.311 kg |
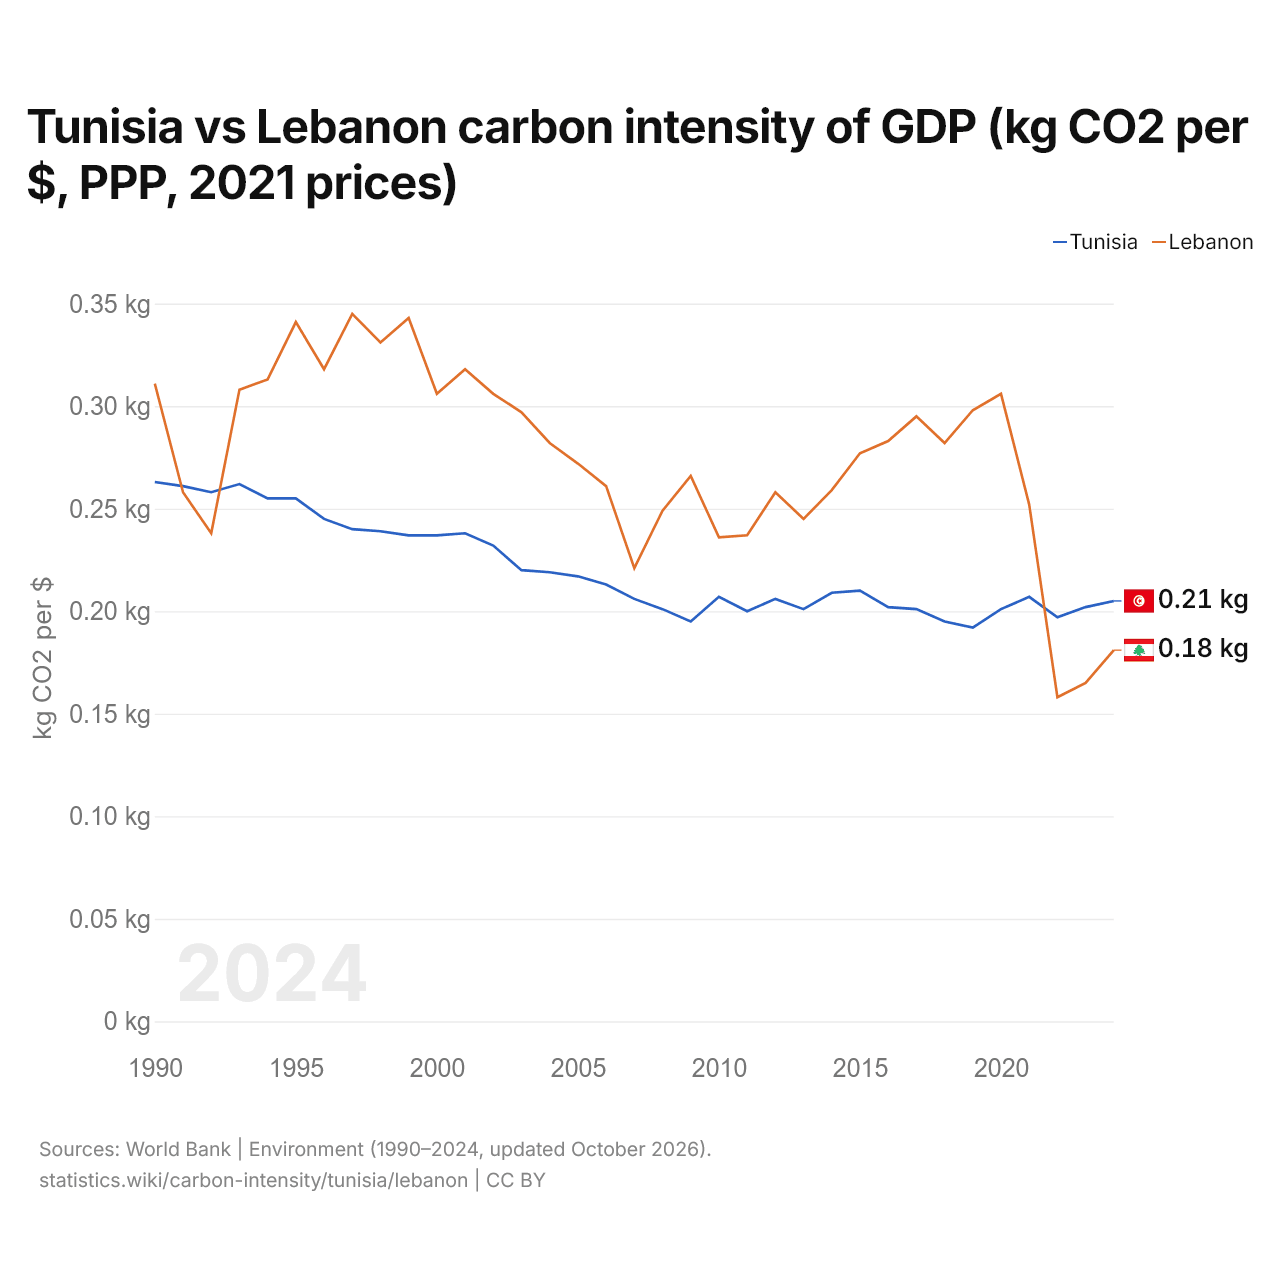
Carbon intensity is 0.205 kg of CO2 per dollar of GDP in Tunisia and 0.181 kg in Lebanon: 0.024 kg more in Tunisia. In 1990, Tunisia emitted 0.263 kg and Lebanon 0.311 kg, a difference of 0.048 kg.
Tunisia's carbon intensity has been higher than Lebanon's every year since 2022. The gap was widest in 1999, when Lebanon's carbon intensity was 0.106 kg above Tunisia's.
Tunisia vs Lebanon: latest carbon intensity of GDP
Compare the carbon intensity of GDP of any 2 countries
Sources:
- World Bank | Environment (1990–2024, updated October 2026)
Creative Commons Attribution (CC BY): you may copy, share, adapt and reuse this content, also commercially, as long as you credit statistics.wiki and note any changes you made. The sources listed above may have their own license terms.