
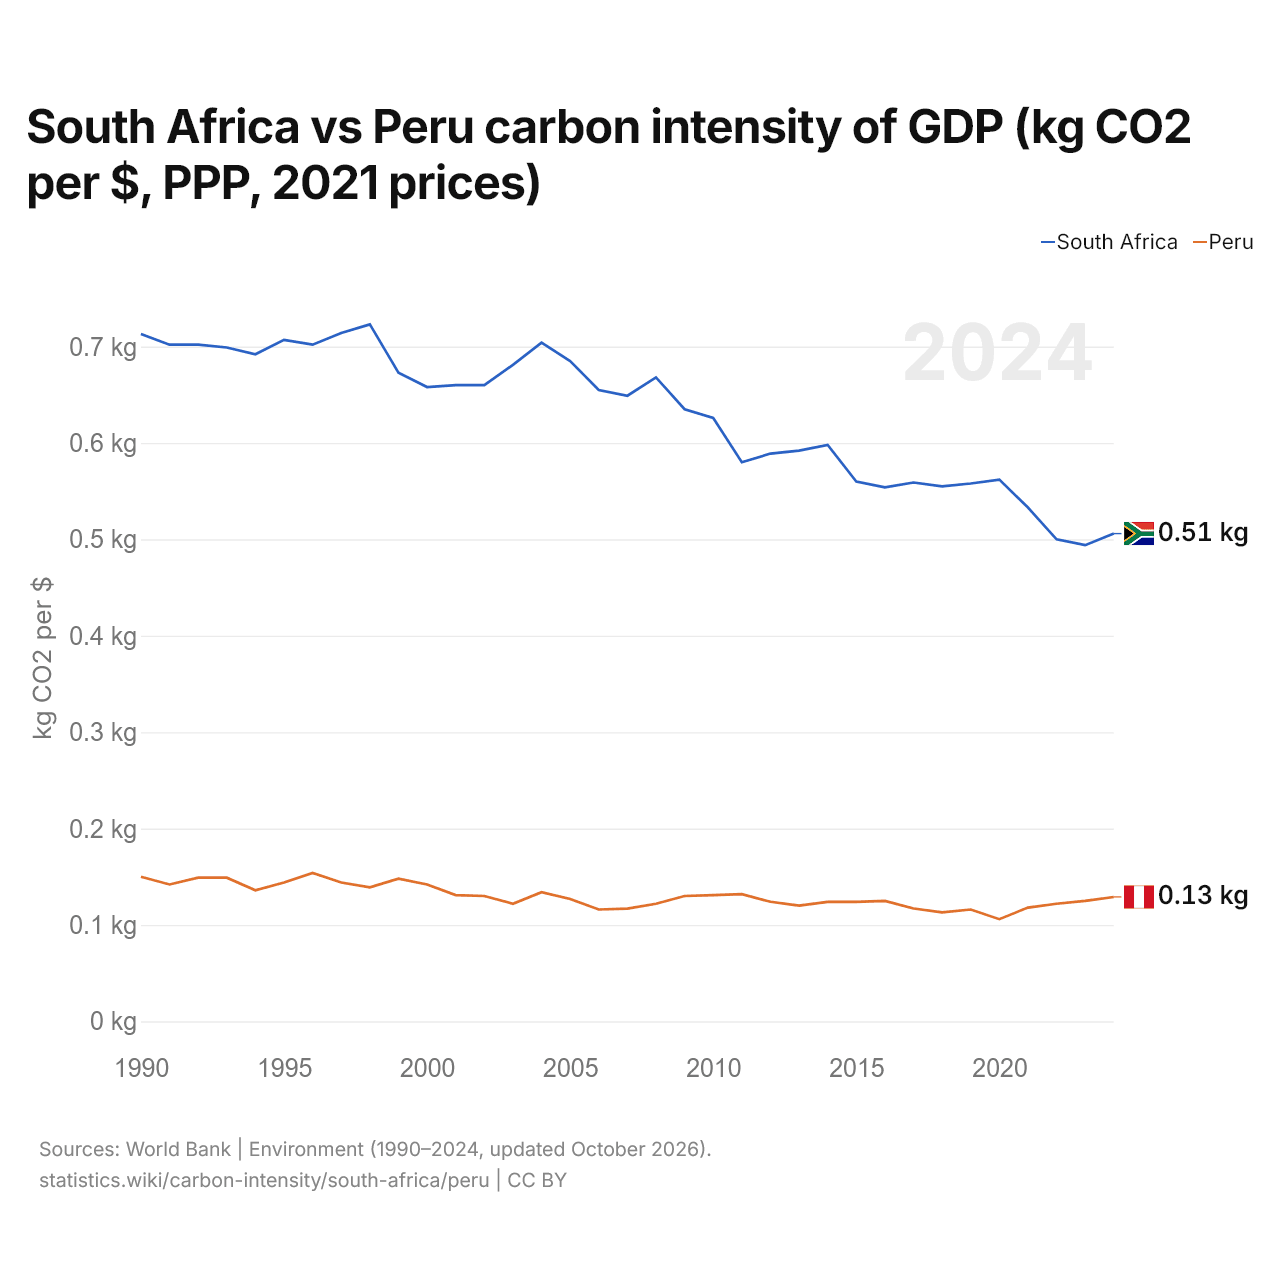
South Africa vs Peru carbon intensity of GDP (kg CO2 per $, PPP, 2021 prices)
1x
| Year | kg CO2 per $ | |
|---|---|---|
 South Africa |
 Peru |
|
| 2024 | 0.506 kg | 0.129 kg |
| 2023 | 0.494 kg | 0.125 kg |
| 2022 | 0.5 kg | 0.122 kg |
| 2021 | 0.533 kg | 0.118 kg |
| 2020 | 0.562 kg | 0.106 kg |
| 2019 | 0.558 kg | 0.116 kg |
| 2018 | 0.555 kg | 0.113 kg |
| 2017 | 0.559 kg | 0.117 kg |
| 2016 | 0.554 kg | 0.125 kg |
| 2015 | 0.56 kg | 0.124 kg |
| 2014 | 0.598 kg | 0.124 kg |
| 2013 | 0.592 kg | 0.12 kg |
| 2012 | 0.589 kg | 0.124 kg |
| 2011 | 0.58 kg | 0.132 kg |
| 2010 | 0.626 kg | 0.131 kg |
| 2009 | 0.635 kg | 0.13 kg |
| 2008 | 0.668 kg | 0.122 kg |
| 2007 | 0.649 kg | 0.117 kg |
| 2006 | 0.655 kg | 0.116 kg |
| 2005 | 0.685 kg | 0.127 kg |
| 2004 | 0.704 kg | 0.134 kg |
| 2003 | 0.681 kg | 0.122 kg |
| 2002 | 0.66 kg | 0.13 kg |
| 2001 | 0.66 kg | 0.131 kg |
| 2000 | 0.658 kg | 0.142 kg |
| 1999 | 0.673 kg | 0.148 kg |
| 1998 | 0.723 kg | 0.139 kg |
| 1997 | 0.714 kg | 0.144 kg |
| 1996 | 0.702 kg | 0.154 kg |
| 1995 | 0.707 kg | 0.144 kg |
| 1994 | 0.692 kg | 0.136 kg |
| 1993 | 0.699 kg | 0.149 kg |
| 1992 | 0.702 kg | 0.149 kg |
| 1991 | 0.702 kg | 0.142 kg |
| 1990 | 0.713 kg | 0.15 kg |
Carbon intensity is 0.506 kg of CO2 per dollar of GDP in South Africa and 0.129 kg in Peru: 0.377 kg more in South Africa. In 1990, South Africa emitted 0.713 kg and Peru 0.150 kg, a difference of 0.563 kg.
South Africa's carbon intensity has been higher than Peru's every year since 1990. The gap was widest in 1998, when South Africa's carbon intensity was 0.584 kg above Peru's.
South Africa vs Peru: latest carbon intensity of GDP
|
South Africa
|
Peru
|
|
|---|---|---|
| kg CO2 per $ of GDP | 0.506 | 0.129 |
| World rank | 7/177 | 89/177 |
| Change since 1990 | −29.1% | −14.0% |
| Carbon intensity difference | 3.9× | 0.25× |
Compare the carbon intensity of GDP of any 2 countries
Sources:
- World Bank | Environment (1990–2024, updated October 2026)
Creative Commons Attribution (CC BY): you may copy, share, adapt and reuse this content, also commercially, as long as you credit statistics.wiki and note any changes you made. The sources listed above may have their own license terms.