
Romania vs Malta carbon intensity of GDP (kg CO2 per $, PPP, 2021 prices)
1x
| Year | kg CO2 per $ | |
|---|---|---|
 Romania |
 Malta |
|
| 2024 | 0.092 kg | 0.051 kg |
| 2023 | 0.092 kg | 0.053 kg |
| 2022 | 0.101 kg | 0.059 kg |
| 2021 | 0.113 kg | 0.055 kg |
| 2020 | 0.111 kg | 0.062 kg |
| 2019 | 0.115 kg | 0.062 kg |
| 2018 | 0.122 kg | 0.061 kg |
| 2017 | 0.127 kg | 0.065 kg |
| 2016 | 0.132 kg | 0.064 kg |
| 2015 | 0.139 kg | 0.082 kg |
| 2014 | 0.141 kg | 0.127 kg |
| 2013 | 0.148 kg | 0.137 kg |
| 2012 | 0.163 kg | 0.167 kg |
| 2011 | 0.17 kg | 0.164 kg |
| 2010 | 0.165 kg | 0.167 kg |
| 2009 | 0.163 kg | 0.172 kg |
| 2008 | 0.19 kg | 0.184 kg |
| 2007 | 0.211 kg | 0.191 kg |
| 2006 | 0.234 kg | 0.196 kg |
| 2005 | 0.238 kg | 0.199 kg |
| 2004 | 0.252 kg | 0.203 kg |
| 2003 | 0.284 kg | 0.204 kg |
| 2002 | 0.279 kg | 0.188 kg |
| 2001 | 0.298 kg | 0.207 kg |
| 2000 | 0.292 kg | 0.176 kg |
| 1999 | 0.286 kg | 0.239 kg |
| 1998 | 0.334 kg | 0.247 kg |
| 1997 | 0.373 kg | 0.269 kg |
| 1996 | 0.39 kg | 0.267 kg |
| 1995 | 0.396 kg | 0.283 kg |
| 1994 | 0.404 kg | 0.318 kg |
| 1993 | 0.429 kg | 0.375 kg |
| 1992 | 0.46 kg | 0.303 kg |
| 1991 | 0.461 kg | 0.324 kg |
| 1990 | 0.496 kg | 0.36 kg |
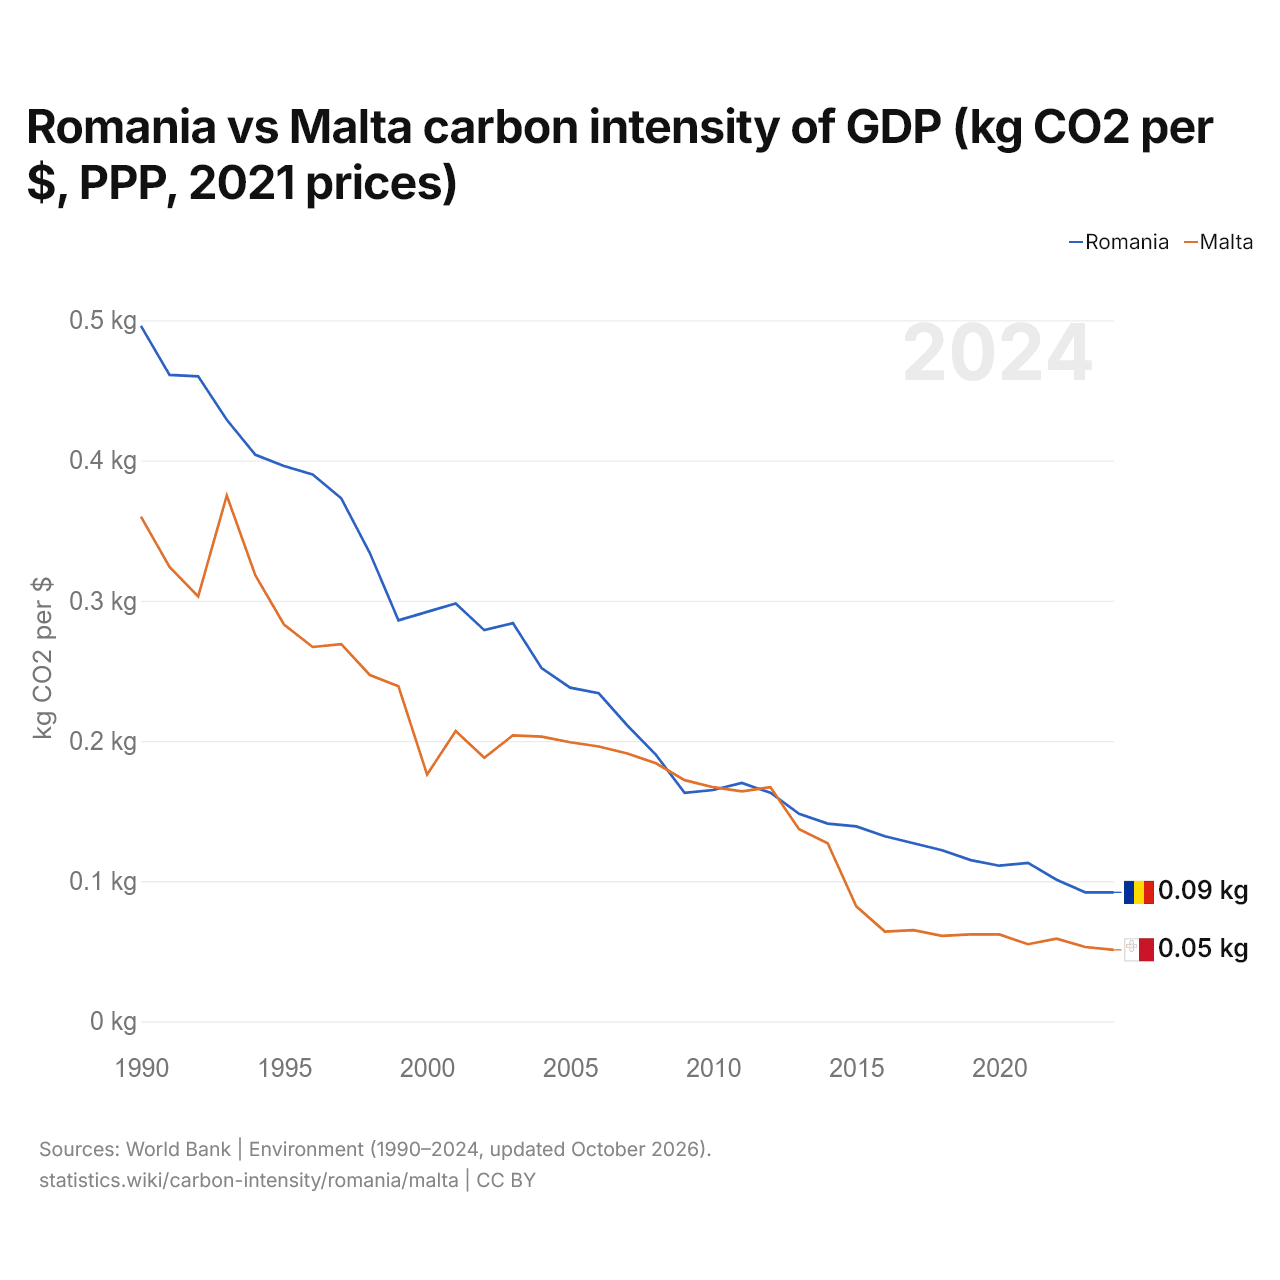
Carbon intensity is 0.092 kg of CO2 per dollar of GDP in Romania and 0.051 kg in Malta: 0.041 kg more in Romania. In 1990, Romania emitted 0.496 kg and Malta 0.360 kg, a difference of 0.136 kg.
Romania's carbon intensity has been higher than Malta's every year since 2013. The gap was widest in 1992, when Romania's carbon intensity was 0.157 kg above Malta's.
Romania vs Malta: latest carbon intensity of GDP
Compare the carbon intensity of GDP of any 2 countries
Sources:
- World Bank | Environment (1990–2024, updated October 2026)
Creative Commons Attribution (CC BY): you may copy, share, adapt and reuse this content, also commercially, as long as you credit statistics.wiki and note any changes you made. The sources listed above may have their own license terms.