
Norway vs Czech Republic carbon intensity of GDP (kg CO2 per $, PPP, 2021 prices)
1x
| Year | kg CO2 per $ | |
|---|---|---|
 Norway |
 Czech Republic |
|
| 2024 | 0.076 kg | 0.149 kg |
| 2023 | 0.08 kg | 0.166 kg |
| 2022 | 0.084 kg | 0.189 kg |
| 2021 | 0.089 kg | 0.198 kg |
| 2020 | 0.091 kg | 0.197 kg |
| 2019 | 0.093 kg | 0.204 kg |
| 2018 | 0.097 kg | 0.222 kg |
| 2017 | 0.1 kg | 0.231 kg |
| 2016 | 0.103 kg | 0.241 kg |
| 2015 | 0.105 kg | 0.244 kg |
| 2014 | 0.105 kg | 0.254 kg |
| 2013 | 0.107 kg | 0.265 kg |
| 2012 | 0.108 kg | 0.276 kg |
| 2011 | 0.112 kg | 0.283 kg |
| 2010 | 0.116 kg | 0.295 kg |
| 2009 | 0.11 kg | 0.3 kg |
| 2008 | 0.113 kg | 0.301 kg |
| 2007 | 0.109 kg | 0.324 kg |
| 2006 | 0.11 kg | 0.338 kg |
| 2005 | 0.112 kg | 0.356 kg |
| 2004 | 0.119 kg | 0.386 kg |
| 2003 | 0.123 kg | 0.401 kg |
| 2002 | 0.116 kg | 0.404 kg |
| 2001 | 0.12 kg | 0.426 kg |
| 2000 | 0.121 kg | 0.438 kg |
| 1999 | 0.14 kg | 0.413 kg |
| 1998 | 0.138 kg | 0.447 kg |
| 1997 | 0.136 kg | 0.466 kg |
| 1996 | 0.136 kg | 0.475 kg |
| 1995 | 0.141 kg | 0.481 kg |
| 1994 | 0.146 kg | 0.514 kg |
| 1993 | 0.146 kg | 0.551 kg |
| 1992 | 0.142 kg | 0.569 kg |
| 1991 | 0.137 kg | 0.589 kg |
| 1990 | 0.151 kg | 0.574 kg |
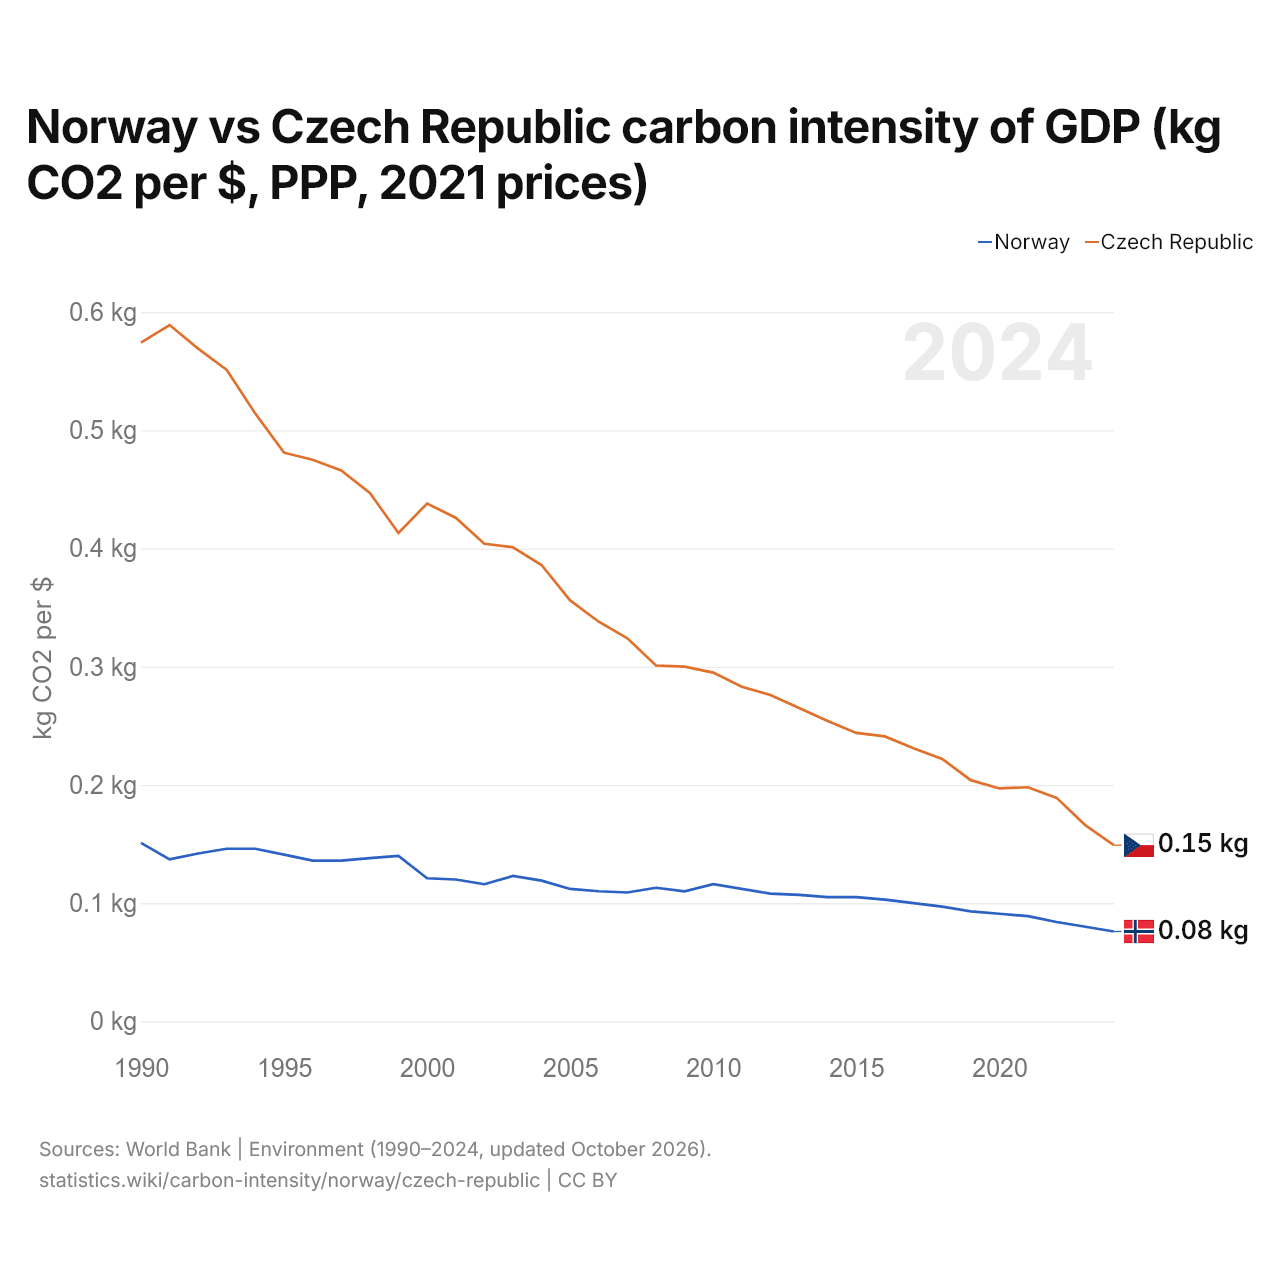
Carbon intensity is 0.076 kg of CO2 per dollar of GDP in Norway and 0.149 kg in the Czech Republic: 0.073 kg more in the Czech Republic. In 1990, Norway emitted 0.151 kg and the Czech Republic 0.574 kg, a difference of 0.423 kg.
The Czech Republic's carbon intensity has been higher than Norway's every year since 1990. The gap was widest in 1991, when the Czech Republic's carbon intensity was 0.452 kg above Norway's.
Norway vs Czech Republic: latest carbon intensity of GDP
|
Norway
|
Czech Republic
|
|
|---|---|---|
| kg CO2 per $ of GDP | 0.076 | 0.149 |
| World rank | 146/177 | 72/177 |
| Change since 1990 | −49.9% | −74.1% |
| Carbon intensity difference | 0.51× | 2× |
Compare the carbon intensity of GDP of any 2 countries
Sources:
- World Bank | Environment (1990–2024, updated October 2026)
Creative Commons Attribution (CC BY): you may copy, share, adapt and reuse this content, also commercially, as long as you credit statistics.wiki and note any changes you made. The sources listed above may have their own license terms.