
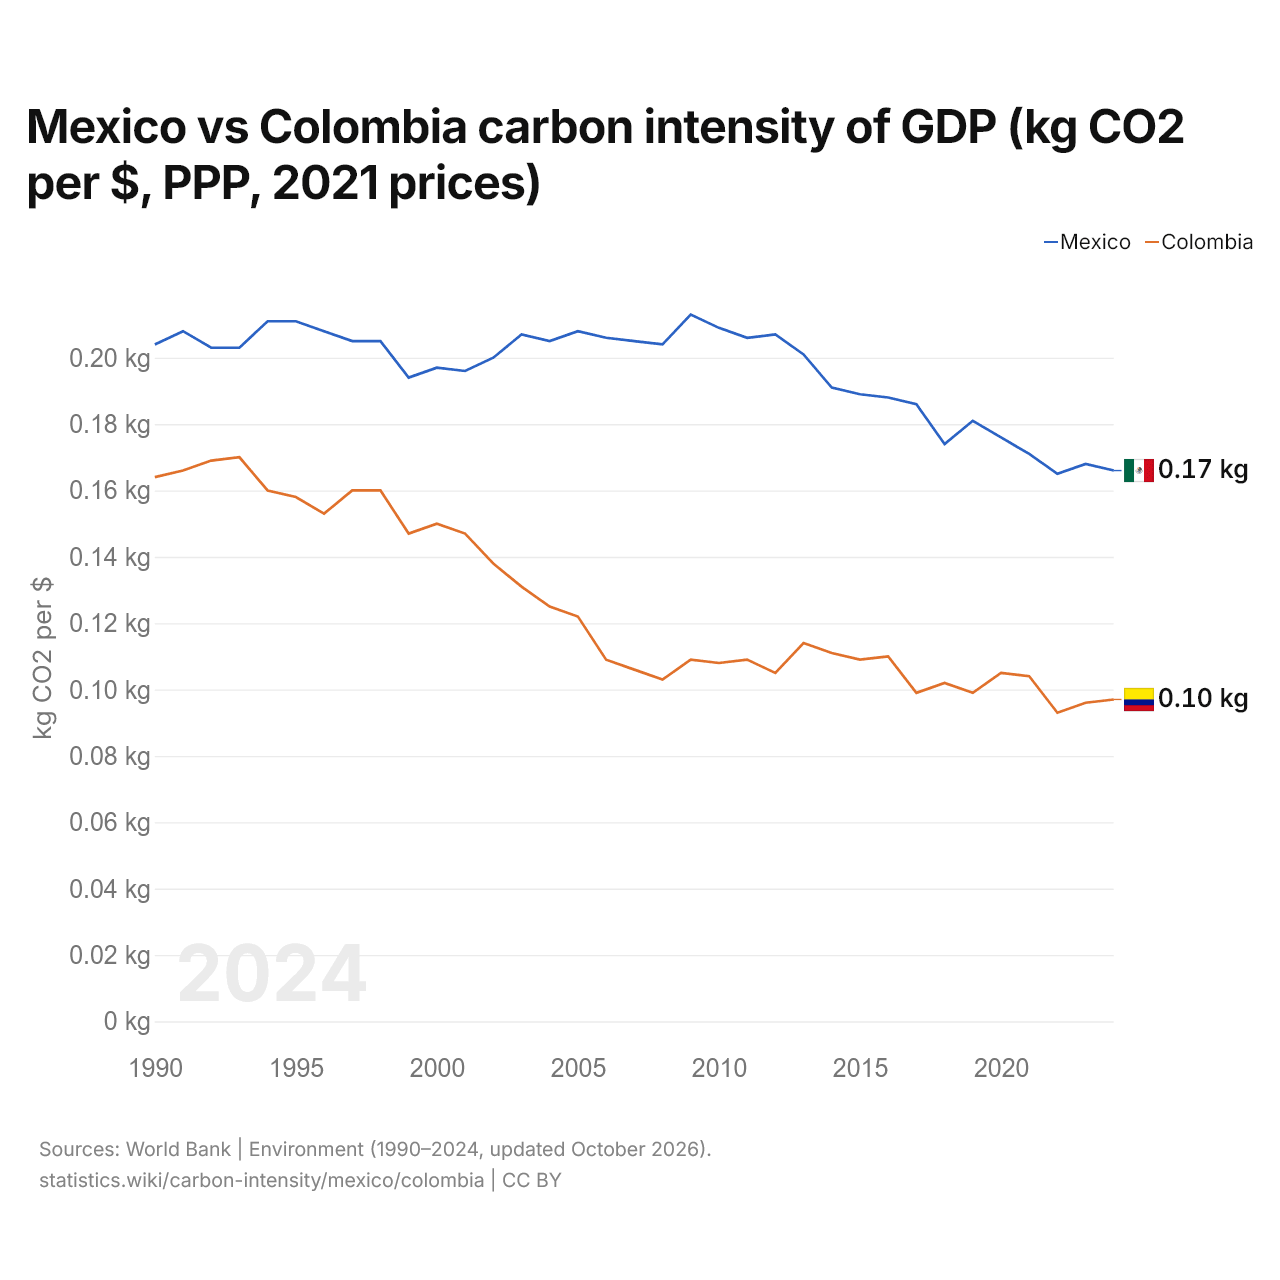
Mexico vs Colombia carbon intensity of GDP (kg CO2 per $, PPP, 2021 prices)
1x
| Year | kg CO2 per $ | |
|---|---|---|
 Mexico |
 Colombia |
|
| 2024 | 0.166 kg | 0.097 kg |
| 2023 | 0.168 kg | 0.096 kg |
| 2022 | 0.165 kg | 0.093 kg |
| 2021 | 0.171 kg | 0.104 kg |
| 2020 | 0.176 kg | 0.105 kg |
| 2019 | 0.181 kg | 0.099 kg |
| 2018 | 0.174 kg | 0.102 kg |
| 2017 | 0.186 kg | 0.099 kg |
| 2016 | 0.188 kg | 0.11 kg |
| 2015 | 0.189 kg | 0.109 kg |
| 2014 | 0.191 kg | 0.111 kg |
| 2013 | 0.201 kg | 0.114 kg |
| 2012 | 0.207 kg | 0.105 kg |
| 2011 | 0.206 kg | 0.109 kg |
| 2010 | 0.209 kg | 0.108 kg |
| 2009 | 0.213 kg | 0.109 kg |
| 2008 | 0.204 kg | 0.103 kg |
| 2007 | 0.205 kg | 0.106 kg |
| 2006 | 0.206 kg | 0.109 kg |
| 2005 | 0.208 kg | 0.122 kg |
| 2004 | 0.205 kg | 0.125 kg |
| 2003 | 0.207 kg | 0.131 kg |
| 2002 | 0.2 kg | 0.138 kg |
| 2001 | 0.196 kg | 0.147 kg |
| 2000 | 0.197 kg | 0.15 kg |
| 1999 | 0.194 kg | 0.147 kg |
| 1998 | 0.205 kg | 0.16 kg |
| 1997 | 0.205 kg | 0.16 kg |
| 1996 | 0.208 kg | 0.153 kg |
| 1995 | 0.211 kg | 0.158 kg |
| 1994 | 0.211 kg | 0.16 kg |
| 1993 | 0.203 kg | 0.17 kg |
| 1992 | 0.203 kg | 0.169 kg |
| 1991 | 0.208 kg | 0.166 kg |
| 1990 | 0.204 kg | 0.164 kg |
Carbon intensity is 0.166 kg of CO2 per dollar of GDP in Mexico and 0.097 kg in Colombia: 0.069 kg more in Mexico. In 1990, Mexico emitted 0.204 kg and Colombia 0.164 kg, a difference of 0.040 kg.
Mexico's carbon intensity has been higher than Colombia's every year since 1990. The gap was widest in 2009, when Mexico's carbon intensity was 0.104 kg above Colombia's.
Mexico vs Colombia: latest carbon intensity of GDP
Compare the carbon intensity of GDP of any 2 countries
Sources:
- World Bank | Environment (1990–2024, updated October 2026)
Creative Commons Attribution (CC BY): you may copy, share, adapt and reuse this content, also commercially, as long as you credit statistics.wiki and note any changes you made. The sources listed above may have their own license terms.