
Malaysia vs Canada carbon intensity of GDP (kg CO2 per $, PPP, 2021 prices)
1x
| Year | kg CO2 per $ | |
|---|---|---|
 Malaysia |
 Canada |
|
| 2024 | 0.244 kg | 0.243 kg |
| 2023 | 0.245 kg | 0.244 kg |
| 2022 | 0.248 kg | 0.252 kg |
| 2021 | 0.252 kg | 0.258 kg |
| 2020 | 0.256 kg | 0.267 kg |
| 2019 | 0.244 kg | 0.281 kg |
| 2018 | 0.254 kg | 0.288 kg |
| 2017 | 0.249 kg | 0.286 kg |
| 2016 | 0.274 kg | 0.286 kg |
| 2015 | 0.292 kg | 0.289 kg |
| 2014 | 0.305 kg | 0.294 kg |
| 2013 | 0.305 kg | 0.3 kg |
| 2012 | 0.296 kg | 0.302 kg |
| 2011 | 0.31 kg | 0.312 kg |
| 2010 | 0.323 kg | 0.315 kg |
| 2009 | 0.318 kg | 0.313 kg |
| 2008 | 0.342 kg | 0.322 kg |
| 2007 | 0.34 kg | 0.336 kg |
| 2006 | 0.331 kg | 0.332 kg |
| 2005 | 0.338 kg | 0.345 kg |
| 2004 | 0.333 kg | 0.342 kg |
| 2003 | 0.328 kg | 0.362 kg |
| 2002 | 0.325 kg | 0.356 kg |
| 2001 | 0.323 kg | 0.353 kg |
| 2000 | 0.307 kg | 0.366 kg |
| 1999 | 0.306 kg | 0.371 kg |
| 1998 | 0.3 kg | 0.382 kg |
| 1997 | 0.285 kg | 0.391 kg |
| 1996 | 0.279 kg | 0.395 kg |
| 1995 | 0.27 kg | 0.39 kg |
| 1994 | 0.286 kg | 0.391 kg |
| 1993 | 0.283 kg | 0.393 kg |
| 1992 | 0.31 kg | 0.404 kg |
| 1991 | 0.321 kg | 0.396 kg |
| 1990 | 0.301 kg | 0.393 kg |
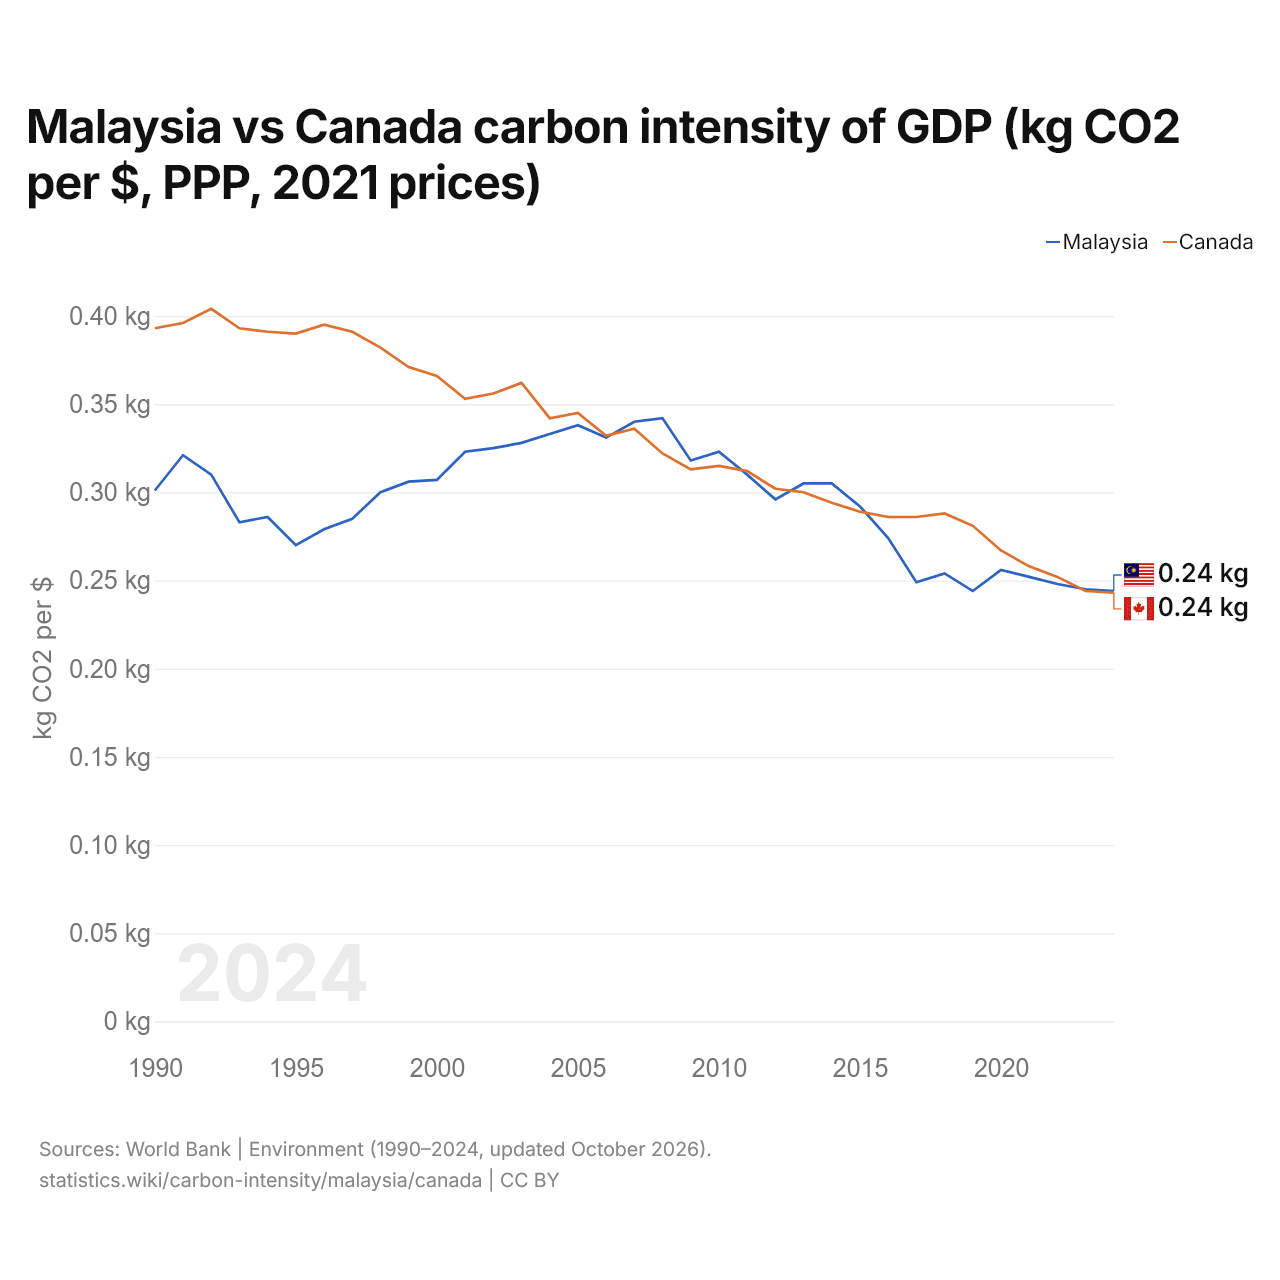
Carbon intensity is 0.244 kg of CO2 per dollar of GDP in Malaysia and 0.243 kg in Canada: 0.001 kg more in Malaysia. In 1990, Malaysia emitted 0.301 kg and Canada 0.393 kg, a difference of 0.092 kg.
The gap was widest in 1995, when Canada's carbon intensity was 0.120 kg above Malaysia's.
Malaysia vs Canada: latest carbon intensity of GDP
Compare the carbon intensity of GDP of any 2 countries
Sources:
- World Bank | Environment (1990–2024, updated October 2026)
Creative Commons Attribution (CC BY): you may copy, share, adapt and reuse this content, also commercially, as long as you credit statistics.wiki and note any changes you made. The sources listed above may have their own license terms.