
China vs Argentina carbon intensity of GDP (kg CO2 per $, PPP, 2021 prices)
1x
| Year | kg CO2 per $ | |
|---|---|---|
 China |
 Argentina |
|
| 2024 | 0.391 kg | 0.15 kg |
| 2023 | 0.407 kg | 0.153 kg |
| 2022 | 0.412 kg | 0.154 kg |
| 2021 | 0.426 kg | 0.156 kg |
| 2020 | 0.441 kg | 0.156 kg |
| 2019 | 0.446 kg | 0.153 kg |
| 2018 | 0.461 kg | 0.155 kg |
| 2017 | 0.47 kg | 0.152 kg |
| 2016 | 0.492 kg | 0.159 kg |
| 2015 | 0.524 kg | 0.157 kg |
| 2014 | 0.568 kg | 0.157 kg |
| 2013 | 0.603 kg | 0.155 kg |
| 2012 | 0.621 kg | 0.155 kg |
| 2011 | 0.649 kg | 0.151 kg |
| 2010 | 0.65 kg | 0.153 kg |
| 2009 | 0.657 kg | 0.157 kg |
| 2008 | 0.669 kg | 0.16 kg |
| 2007 | 0.712 kg | 0.161 kg |
| 2006 | 0.748 kg | 0.165 kg |
| 2005 | 0.759 kg | 0.168 kg |
| 2004 | 0.746 kg | 0.179 kg |
| 2003 | 0.714 kg | 0.176 kg |
| 2002 | 0.68 kg | 0.176 kg |
| 2001 | 0.688 kg | 0.166 kg |
| 2000 | 0.711 kg | 0.165 kg |
| 1999 | 0.729 kg | 0.167 kg |
| 1998 | 0.803 kg | 0.16 kg |
| 1997 | 0.845 kg | 0.157 kg |
| 1996 | 0.898 kg | 0.164 kg |
| 1995 | 0.995 kg | 0.159 kg |
| 1994 | 1 kg | 0.153 kg |
| 1993 | 1.072 kg | 0.157 kg |
| 1992 | 1.129 kg | 0.164 kg |
| 1991 | 1.232 kg | 0.174 kg |
| 1990 | 1.276 kg | 0.18 kg |
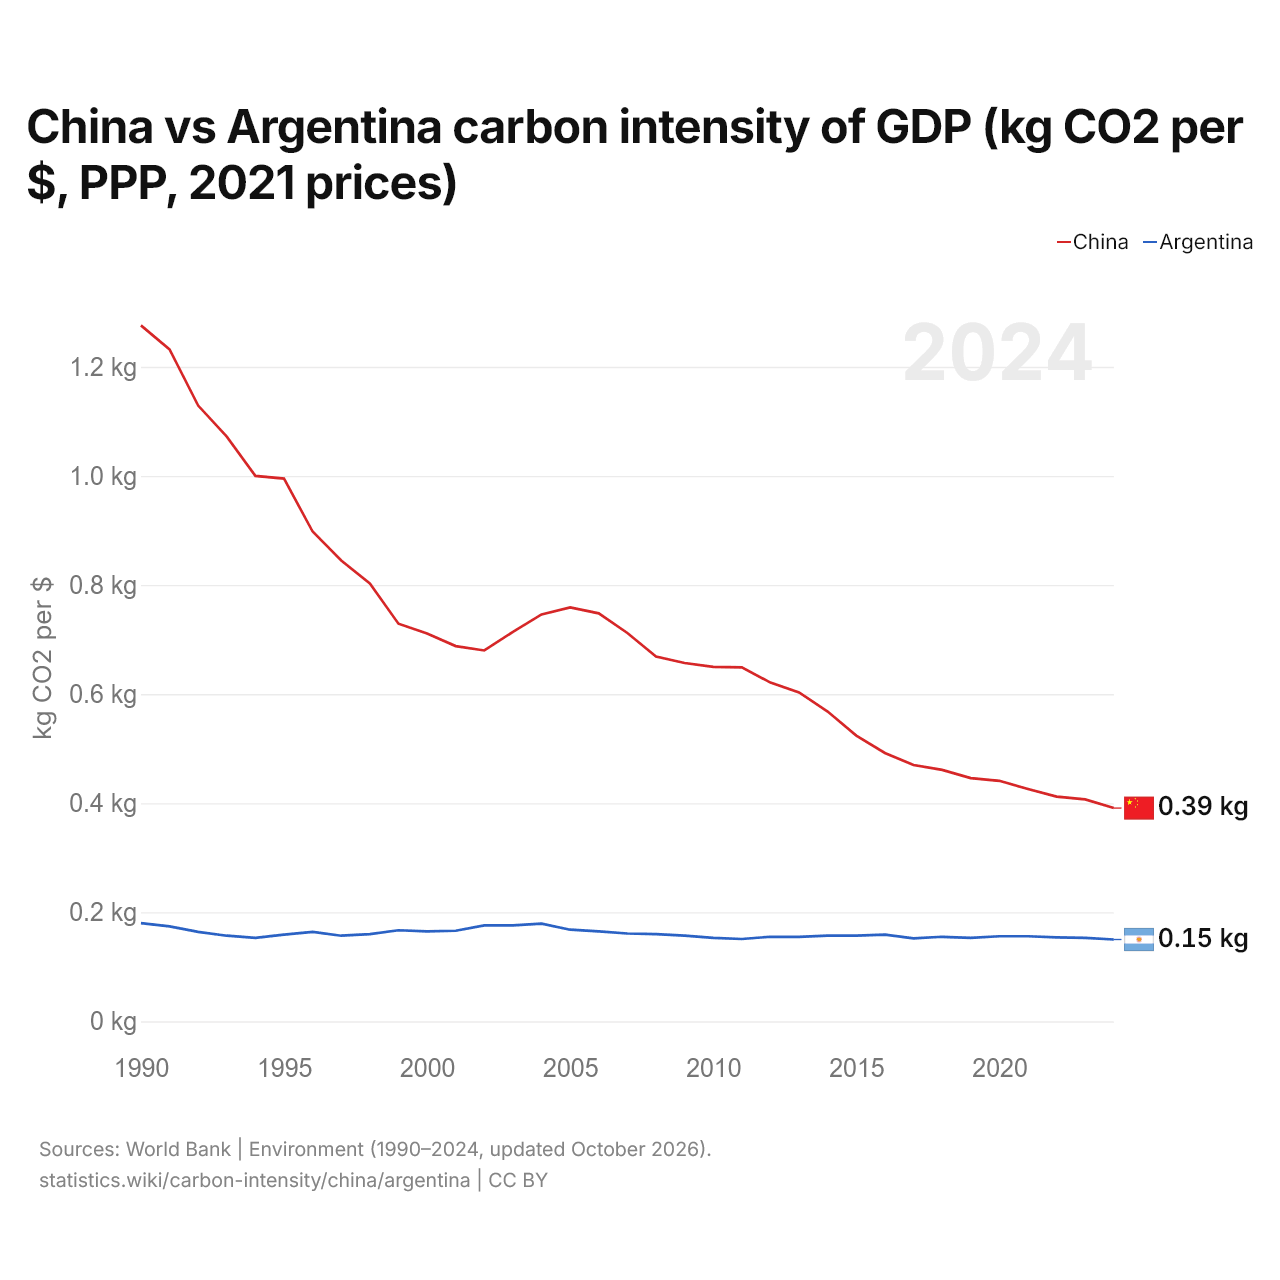
Carbon intensity is 0.391 kg of CO2 per dollar of GDP in China and 0.150 kg in Argentina: 0.241 kg more in China. In 1990, China emitted 1.276 kg and Argentina 0.180 kg, a difference of 1.096 kg.
China's carbon intensity has been higher than Argentina's every year since 1990.
China vs Argentina: latest carbon intensity of GDP
Compare the carbon intensity of GDP of any 2 countries
Sources:
- World Bank | Environment (1990–2024, updated October 2026)
Creative Commons Attribution (CC BY): you may copy, share, adapt and reuse this content, also commercially, as long as you credit statistics.wiki and note any changes you made. The sources listed above may have their own license terms.