
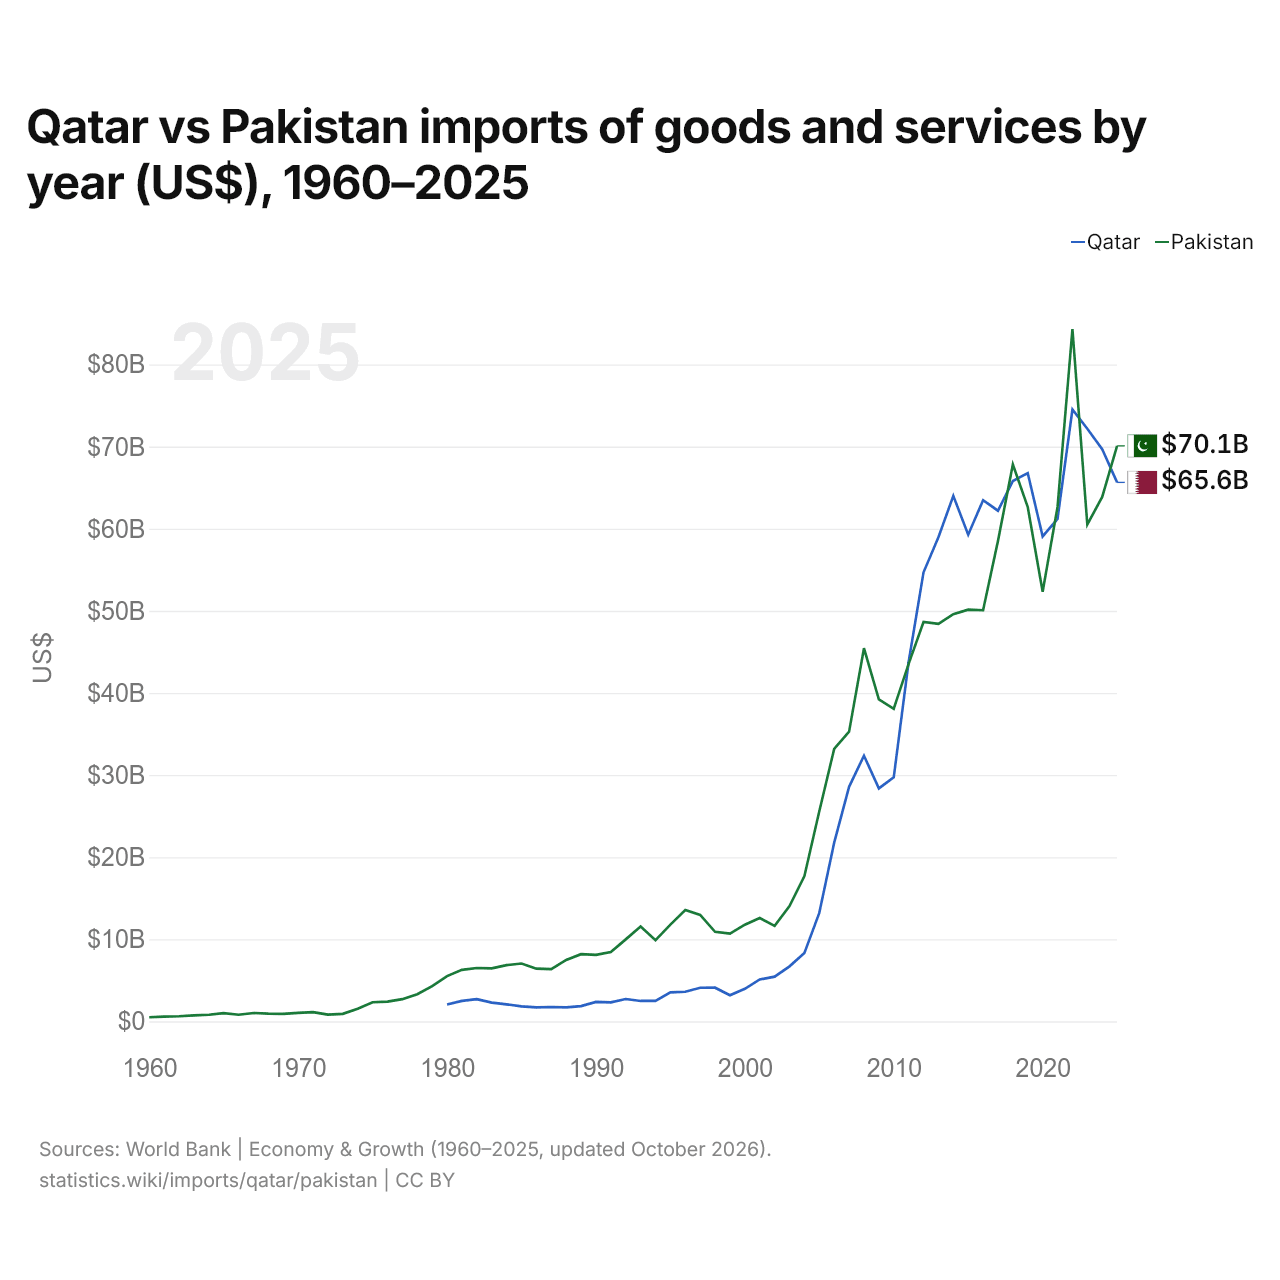
Catar vs Paquistão: importações de bens e serviços por ano (US$), 1960–2025
1x
| Ano | US$ | |
|---|---|---|
 Catar |
 Paquistão |
|
| 2025 | US$ 65.640.384.615 | US$ 70.090.772.303 |
| 2024 | US$ 69.692.032.967 | US$ 63.865.509.443 |
| 2023 | US$ 72.174.450.549 | US$ 60.515.108.026 |
| 2022 | US$ 74.520.054.945 | US$ 84.315.688.680 |
| 2021 | US$ 61.204.395.604 | US$ 62.659.182.540 |
| 2020 | US$ 59.064.560.440 | US$ 52.327.295.403 |
| 2019 | US$ 66.769.780.220 | US$ 62.624.564.039 |
| 2018 | US$ 65.810.989.011 | US$ 67.821.965.005 |
| 2017 | US$ 62.192.582.418 | US$ 58.514.391.836 |
| 2016 | US$ 63.475.274.725 | US$ 50.070.595.635 |
| 2015 | US$ 59.271.428.571 | US$ 50.134.759.860 |
| 2014 | US$ 64.004.395.604 | US$ 49.596.212.908 |
| 2013 | US$ 58.953.296.703 | US$ 48.401.946.136 |
| 2012 | US$ 54.693.498.159 | US$ 48.633.322.391 |
| 2011 | US$ 43.792.582.418 | US$ 43.534.938.844 |
| 2010 | US$ 29.717.307.692 | US$ 38.066.808.316 |
| 2009 | US$ 28.370.604.396 | US$ 39.220.849.369 |
| 2008 | US$ 32.356.868.132 | US$ 45.441.542.692 |
| 2007 | US$ 28.566.208.791 | US$ 35.286.555.607 |
| 2006 | US$ 21.767.307.692 | US$ 33.184.884.875 |
| 2005 | US$ 13.207.967.033 | US$ 25.595.408.507 |
| 2004 | US$ 8.315.659.341 | US$ 17.697.600.000 |
| 2003 | US$ 6.699.450.549 | US$ 14.030.211.712 |
| 2002 | US$ 5.446.428.571 | US$ 11.619.627.152 |
| 2001 | US$ 5.099.450.549 | US$ 12.581.363.105 |
| 2000 | US$ 3.965.659.341 | US$ 11.769.388.548 |
| 1999 | US$ 3.184.065.934 | US$ 10.684.436.463 |
| 1998 | US$ 4.098.351.648 | US$ 10.900.343.052 |
| 1997 | US$ 4.085.989.011 | US$ 12.967.600.154 |
| 1996 | US$ 3.604.120.879 | US$ 13.567.628.711 |
| 1995 | US$ 3.526.098.984 | US$ 11.777.213.240 |
| 1994 | US$ 2.490.659.341 | US$ 9.883.122.490 |
| 1993 | US$ 2.482.692.308 | US$ 11.552.190.707 |
| 1992 | US$ 2.717.032.967 | US$ 9.984.113.697 |
| 1991 | US$ 2.308.791.209 | US$ 8.434.875.711 |
| 1990 | US$ 2.363.461.538 | US$ 8.100.453.419 |
| 1989 | US$ 1.852.747.253 | US$ 8.174.710.143 |
| 1988 | US$ 1.699.175.824 | US$ 7.473.483.338 |
| 1987 | US$ 1.746.978.022 | US$ 6.366.035.537 |
| 1986 | US$ 1.694.230.769 | US$ 6.415.065.096 |
| 1985 | US$ 1.815.934.066 | US$ 7.040.171.504 |
| 1984 | US$ 2.070.604.396 | US$ 6.843.425.349 |
| 1983 | US$ 2.279.120.879 | US$ 6.458.110.236 |
| 1982 | US$ 2.695.329.670 | US$ 6.492.985.782 |
| 1981 | US$ 2.489.835.165 | US$ 6.275.656.566 |
| 1980 | US$ 2.044.863.954 | US$ 5.512.929.293 |
| 1979 | - | US$ 4.295.858.586 |
| 1978 | - | US$ 3.292.929.293 |
| 1977 | - | US$ 2.701.111.111 |
| 1976 | - | US$ 2.409.494.949 |
| 1975 | - | US$ 2.324.848.485 |
| 1974 | - | US$ 1.535.555.556 |
| 1973 | - | US$ 907.783.978 |
| 1972 | - | US$ 814.017.565 |
| 1971 | - | US$ 1.117.807.644 |
| 1970 | - | US$ 1.037.799.244 |
| 1969 | - | US$ 916.841.663 |
| 1968 | - | US$ 932.801.344 |
| 1967 | - | US$ 1.013.229.735 |
| 1966 | - | US$ 806.173.877 |
| 1965 | - | US$ 1.007.139.857 |
| 1964 | - | US$ 801.763.965 |
| 1963 | - | US$ 732.255.355 |
| 1962 | - | US$ 620.327.593 |
| 1961 | - | US$ 577.278.454 |
| 1960 | - | US$ 495.590.088 |
Em 2025, as importações de bens e serviços do Catar foram de US$ 65,6 bilhões e as do Paquistão, de US$ 70,1 bilhões: as do Paquistão foram 6,8% maiores. Em 1980, as importações do Paquistão foram 2,7 vezes maiores: US$ 2,04 bilhões do Catar e US$ 5,51 bilhões do Paquistão.
Catar vs Paquistão: dados de importações
|
Catar
|
Paquistão
|
|
|---|---|---|
| Importações | US$ 65,6 bi (2025) | US$ 70,1 bi (2025) |
| Posição mundial | 61/174 | 56/174 |
| Participação mundial | 0,19% | 0,21% |
| % do PIB | 30,5% | 17,2% |
| Maior categoria de bens | Máquinas, eletrônicos e veículos (42,8%, 2024) | Petróleo, gás, minérios e outras matérias-primas (29,3%, 2025) |
| Principal origem dos bens | China (15%, 2024) | China (31,4%, 2025) |
Comparar as importações de 2 países quaisquer
Fontes:
- Banco Mundial | Economy & Growth (1960–2025, atualizado em outubro de 2026)
- TradeMap (2001–2025, atualizado em outubro de 2026)
Creative Commons Atribuição (CC BY): você pode copiar, compartilhar, adaptar e reutilizar este conteúdo, inclusive para fins comerciais, desde que cite o statistics.wiki e indique as alterações que fizer. As fontes listadas acima podem ter suas próprias condições de licença.