
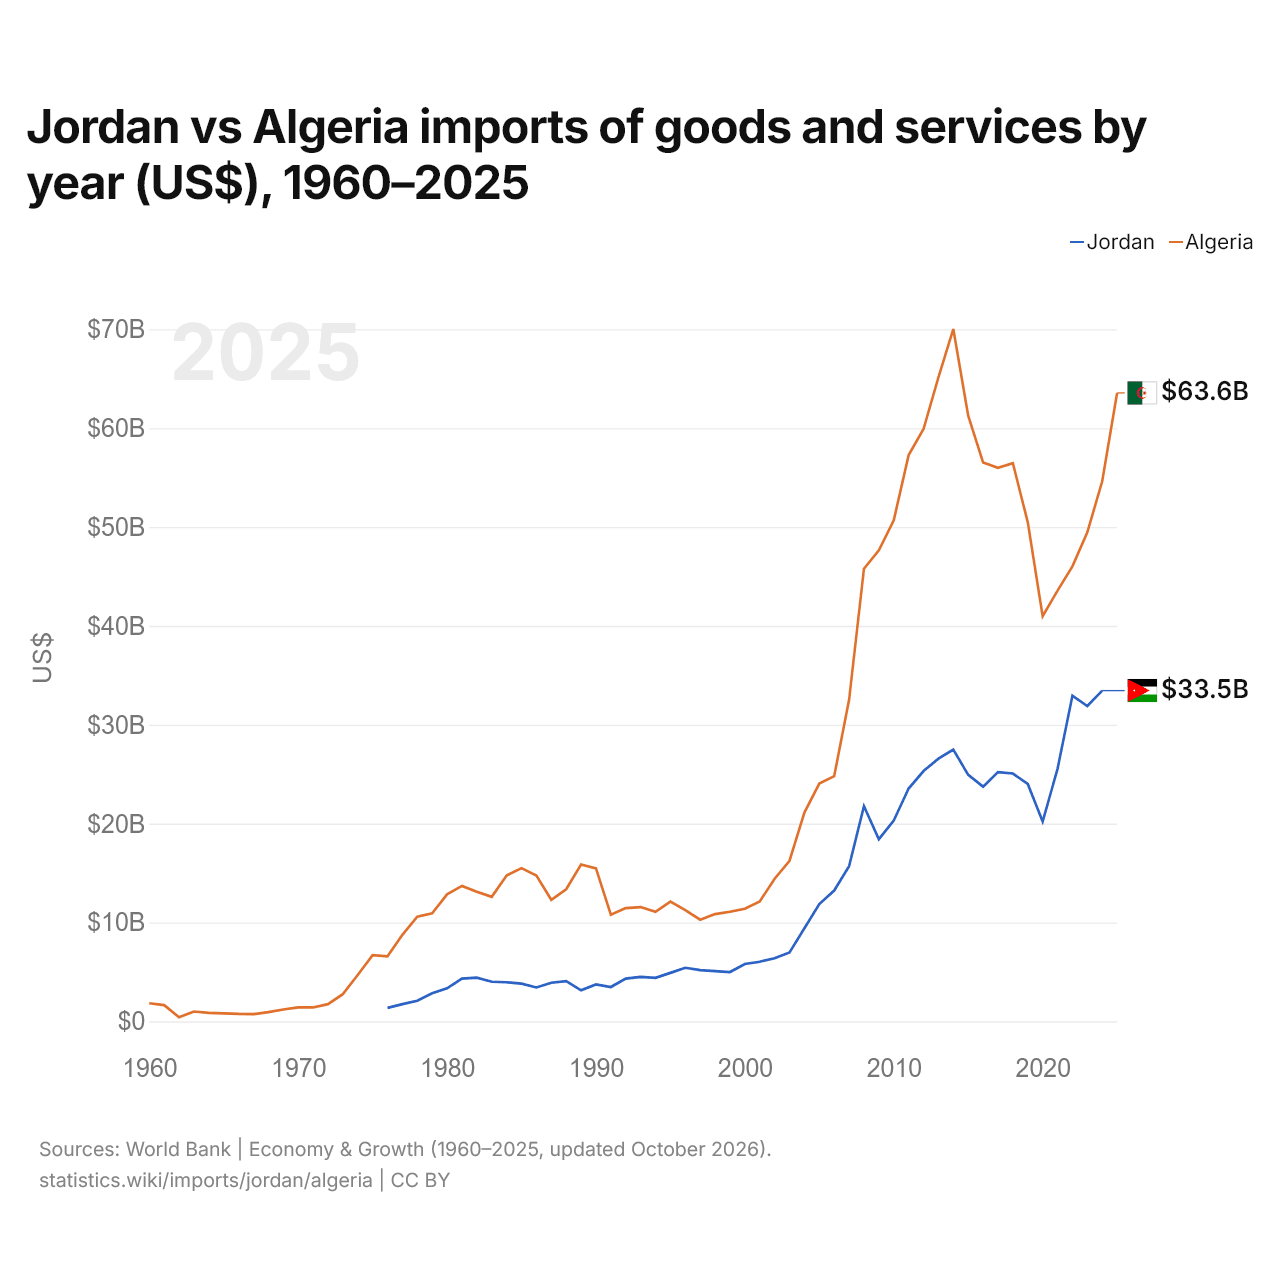
Jordânia vs Argélia: importações de bens e serviços por ano (US$), 1960–2025
1x
| Ano | US$ | |
|---|---|---|
 Jordânia |
 Argélia |
|
| 2025 | - | US$ 63.560.679.354 |
| 2024 | US$ 33.451.981.382 | US$ 54.624.467.792 |
| 2023 | US$ 31.895.522.218 | US$ 49.460.165.881 |
| 2022 | US$ 32.943.947.726 | US$ 46.015.346.670 |
| 2021 | US$ 25.541.330.539 | US$ 43.564.492.198 |
| 2020 | US$ 20.208.037.930 | US$ 40.978.554.436 |
| 2019 | US$ 24.005.382.314 | US$ 50.490.845.024 |
| 2018 | US$ 25.063.585.109 | US$ 56.446.212.848 |
| 2017 | US$ 25.209.987.540 | US$ 55.990.439.550 |
| 2016 | US$ 23.733.998.800 | US$ 56.532.525.720 |
| 2015 | US$ 24.933.413.671 | US$ 61.266.393.934 |
| 2014 | US$ 27.484.782.185 | US$ 70.019.891.159 |
| 2013 | US$ 26.570.407.893 | US$ 65.124.130.006 |
| 2012 | US$ 25.314.334.570 | US$ 59.908.816.253 |
| 2011 | US$ 23.549.677.201 | US$ 57.272.844.072 |
| 2010 | US$ 20.303.976.100 | US$ 50.674.049.706 |
| 2009 | US$ 18.420.888.533 | US$ 47.648.700.297 |
| 2008 | US$ 21.768.588.616 | US$ 45.783.784.537 |
| 2007 | US$ 15.700.423.131 | US$ 32.522.138.070 |
| 2006 | US$ 13.231.029.619 | US$ 24.802.903.073 |
| 2005 | US$ 11.859.379.408 | US$ 24.052.494.566 |
| 2004 | US$ 9.406.911.142 | US$ 21.108.011.868 |
| 2003 | US$ 6.967.136.812 | US$ 16.239.633.129 |
| 2002 | US$ 6.383.638.928 | US$ 14.427.027.970 |
| 2001 | US$ 6.027.365.959 | US$ 12.125.335.043 |
| 2000 | US$ 5.795.768.688 | US$ 11.390.170.996 |
| 1999 | US$ 4.984.463.329 | US$ 11.079.856.776 |
| 1998 | US$ 5.084.211.425 | US$ 10.850.007.516 |
| 1997 | US$ 5.180.015.233 | US$ 10.279.946.208 |
| 1996 | US$ 5.415.937.800 | US$ 11.240.014.124 |
| 1995 | US$ 4.901.826.484 | US$ 12.110.069.749 |
| 1994 | US$ 4.394.962.931 | US$ 11.084.076.997 |
| 1993 | US$ 4.493.535.695 | US$ 11.556.877.008 |
| 1992 | US$ 4.323.657.361 | US$ 11.458.103.093 |
| 1991 | US$ 3.469.992.627 | US$ 10.788.791.994 |
| 1990 | US$ 3.727.972.374 | US$ 15.473.054.068 |
| 1989 | US$ 3.140.576.704 | US$ 15.863.715.871 |
| 1988 | US$ 4.060.198.989 | US$ 13.356.401.461 |
| 1987 | US$ 3.899.142.880 | US$ 12.289.313.328 |
| 1986 | US$ 3.427.475.812 | US$ 14.758.682.284 |
| 1985 | US$ 3.807.918.910 | US$ 15.493.853.614 |
| 1984 | US$ 3.951.204.921 | US$ 14.749.040.620 |
| 1983 | US$ 4.002.434.732 | US$ 12.591.881.327 |
| 1982 | US$ 4.413.433.496 | US$ 13.109.208.304 |
| 1981 | US$ 4.320.089.095 | US$ 13.693.843.725 |
| 1980 | US$ 3.335.403.206 | US$ 12.847.073.135 |
| 1979 | US$ 2.837.517.023 | US$ 10.925.793.281 |
| 1978 | US$ 2.077.382.413 | US$ 10.590.281.903 |
| 1977 | US$ 1.738.406.825 | US$ 8.753.826.797 |
| 1976 | US$ 1.363.021.601 | US$ 6.580.487.773 |
| 1975 | - | US$ 6.684.546.140 |
| 1974 | - | US$ 4.688.153.800 |
| 1973 | - | US$ 2.750.792.039 |
| 1972 | - | US$ 1.740.871.306 |
| 1971 | - | US$ 1.404.540.636 |
| 1970 | - | US$ 1.417.847.869 |
| 1969 | - | US$ 1.195.043.265 |
| 1968 | - | US$ 931.728.600 |
| 1967 | - | US$ 729.178.904 |
| 1966 | - | US$ 749.433.874 |
| 1965 | - | US$ 810.198.782 |
| 1964 | - | US$ 856.495.850 |
| 1963 | - | US$ 995.387.052 |
| 1962 | - | US$ 416.673.668 |
| 1961 | - | US$ 1.643.546.078 |
| 1960 | - | US$ 1.828.734.328 |
As importações de bens e serviços da Jordânia foram de US$ 33,5 bilhões (2024) e as da Argélia, de US$ 54,6 bilhões (2024): as da Argélia foram 1,6 vezes maiores. Em 1976, as importações da Argélia foram 4,8 vezes maiores: US$ 1,36 bilhão da Jordânia e US$ 6,58 bilhões da Argélia.
As importações de bens e serviços da Argélia têm sido maiores que as da Jordânia todos os anos desde 1976.
Jordânia vs Argélia: dados de importações
|
Jordânia
|
Argélia
|
|
|---|---|---|
| Importações | US$ 33,5 bi (2024) | US$ 63,6 bi (2025) |
| Posição mundial | 79/174 | 62/174 |
| Participação mundial | 0,11% | 0,19% |
| % do PIB | 57,1% | 22,1% |
| Maior categoria de bens | Máquinas, eletrônicos e veículos (25%, 2025) | Máquinas, eletrônicos e veículos (29,9%, 2024) |
| Principal origem dos bens | China (20,3%, 2025) | China (22,3%, 2024) |
Comparar as importações de 2 países quaisquer
Fontes:
- Banco Mundial | Economy & Growth (1960–2025, atualizado em outubro de 2026)
- TradeMap (2001–2025, atualizado em outubro de 2026)
Creative Commons Atribuição (CC BY): você pode copiar, compartilhar, adaptar e reutilizar este conteúdo, inclusive para fins comerciais, desde que cite o statistics.wiki e indique as alterações que fizer. As fontes listadas acima podem ter suas próprias condições de licença.