
Irã vs Canadá: reservas internacionais (incluindo ouro) por ano, 1960–2025
1x
| Ano | US$ | |
|---|---|---|
 Irã |
 Canadá |
|
| 2025 | - | US$ 125.626.898.210 |
| 2024 | - | US$ 119.778.473.397 |
| 2023 | - | US$ 117.550.899.245 |
| 2022 | - | US$ 106.952.377.365 |
| 2021 | - | US$ 106.615.119.570 |
| 2020 | - | US$ 90.428.136.419 |
| 2019 | - | US$ 85.297.110.784 |
| 2018 | - | US$ 83.925.602.808 |
| 2017 | - | US$ 86.677.706.697 |
| 2016 | - | US$ 82.718.110.858 |
| 2015 | - | US$ 79.753.521.150 |
| 2014 | - | US$ 74.699.962.253 |
| 2013 | - | US$ 71.937.085.416 |
| 2012 | - | US$ 68.546.343.362 |
| 2011 | - | US$ 65.818.985.667 |
| 2010 | - | US$ 57.151.157.771 |
| 2009 | - | US$ 54.356.329.767 |
| 2008 | - | US$ 43.872.316.564 |
| 2007 | - | US$ 41.082.108.779 |
| 2006 | - | US$ 35.063.091.947 |
| 2005 | - | US$ 33.018.041.276 |
| 2004 | - | US$ 34.476.385.088 |
| 2003 | - | US$ 36.267.581.049 |
| 2002 | - | US$ 37.189.390.324 |
| 2001 | - | US$ 34.252.695.468 |
| 2000 | - | US$ 32.427.268.296 |
| 1999 | - | US$ 28.650.287.867 |
| 1998 | - | US$ 24.023.245.895 |
| 1997 | - | US$ 18.718.498.840 |
| 1996 | - | US$ 21.562.298.750 |
| 1995 | - | US$ 16.369.362.024 |
| 1994 | - | US$ 13.774.515.278 |
| 1993 | - | US$ 14.845.679.468 |
| 1992 | - | US$ 14.744.867.435 |
| 1991 | - | US$ 20.836.199.991 |
| 1990 | - | US$ 23.529.517.647 |
| 1989 | - | US$ 22.511.818.355 |
| 1988 | - | US$ 22.421.917.624 |
| 1987 | - | US$ 16.241.919.192 |
| 1986 | - | US$ 10.961.351.035 |
| 1985 | - | US$ 9.077.363.670 |
| 1984 | - | US$ 8.699.532.578 |
| 1983 | - | US$ 11.161.317.127 |
| 1982 | US$ 7.685.456.407 | US$ 12.269.212.046 |
| 1981 | US$ 3.331.695.372 | US$ 11.671.918.705 |
| 1980 | US$ 12.783.023.465 | US$ 15.461.831.432 |
| 1979 | US$ 17.207.747.367 | US$ 14.219.999.489 |
| 1978 | US$ 12.840.645.493 | US$ 8.558.516.042 |
| 1977 | US$ 12.729.171.532 | US$ 7.301.923.098 |
| 1976 | US$ 9.184.961.807 | US$ 7.876.981.014 |
| 1975 | US$ 9.267.871.108 | US$ 7.504.993.349 |
| 1974 | US$ 8.920.357.632 | US$ 8.978.681.010 |
| 1973 | US$ 1.498.630.790 | US$ 7.305.435.935 |
| 1972 | US$ 1.061.180.295 | US$ 6.640.230.810 |
| 1971 | US$ 642.577.379 | US$ 5.828.802.080 |
| 1970 | US$ 216.875.910 | US$ 4.732.515.670 |
| 1969 | US$ 310.902.800 | US$ 3.111.279.600 |
| 1968 | US$ 322.136.600 | US$ 3.215.954.000 |
| 1967 | US$ 325.062.800 | US$ 2.722.684.400 |
| 1966 | US$ 268.925.660 | US$ 2.707.536.060 |
| 1965 | US$ 251.965.520 | US$ 3.040.845.600 |
| 1964 | US$ 191.508.480 | US$ 2.893.026.720 |
| 1963 | US$ 241.829.560 | US$ 2.615.182.920 |
| 1962 | US$ 210.768.020 | US$ 2.561.922.010 |
| 1961 | US$ 209.547.100 | US$ 2.296.085.100 |
| 1960 | US$ 185.218.400 | US$ 2.012.986.400 |
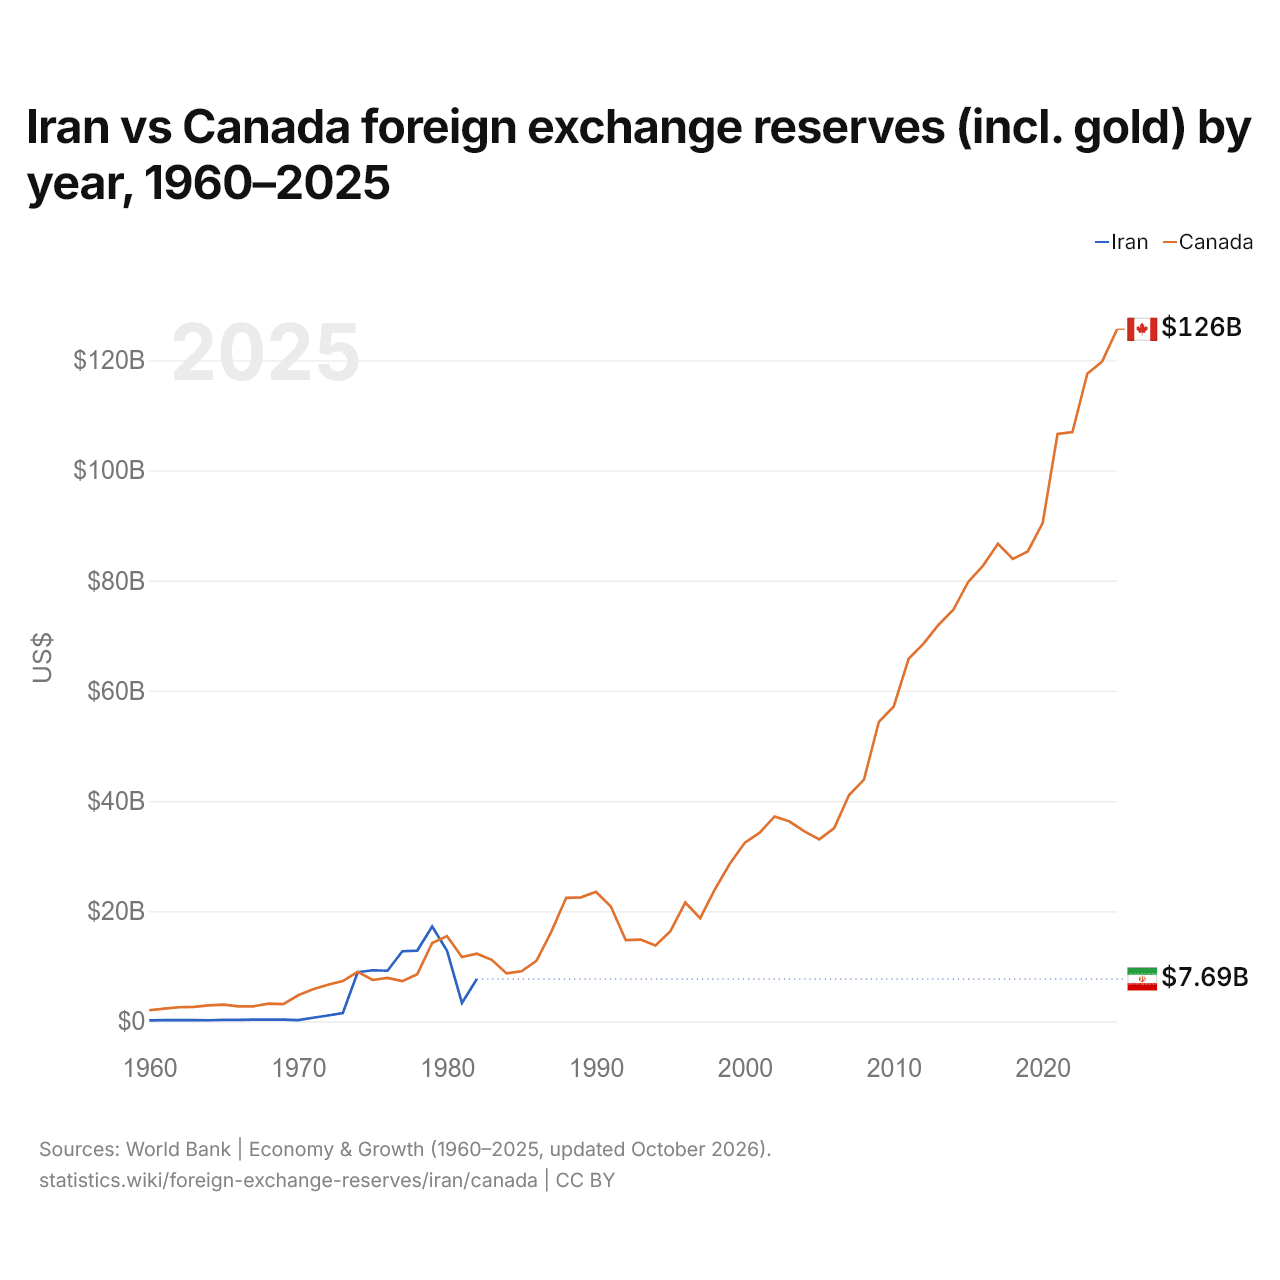
As reservas internacionais do Irã são de US$ 7,69 bilhões (1982), e as do Canadá, de US$ 126 bilhões (2025). Em 1960, as reservas do Canadá foram 11 vezes maiores: US$ 185 milhões do Irã e US$ 2,01 bilhões do Canadá.
As reservas internacionais do Canadá têm sido maiores que as do Irã todos os anos desde 1980.
Irã vs Canadá: reservas, incluindo ouro, e meses de importações cobertos
|
Irã
|
Canadá
|
|
|---|---|---|
| Reservas, incluindo ouro | US$ 7,69 bi (1982) | US$ 126 bi (2025) |
| Meses de importações | 3,5 (1982) | 2,0 (2025) |
| Posição mundial | Sem classificação | 26/168 |
Comparar as reservas internacionais de 2 países quaisquer
Fontes:
- Banco Mundial | Economy & Growth (1960–2025, atualizado em outubro de 2026)
Creative Commons Atribuição (CC BY): você pode copiar, compartilhar, adaptar e reutilizar este conteúdo, inclusive para fins comerciais, desde que cite o statistics.wiki e indique as alterações que fizer. As fontes listadas acima podem ter suas próprias condições de licença.