
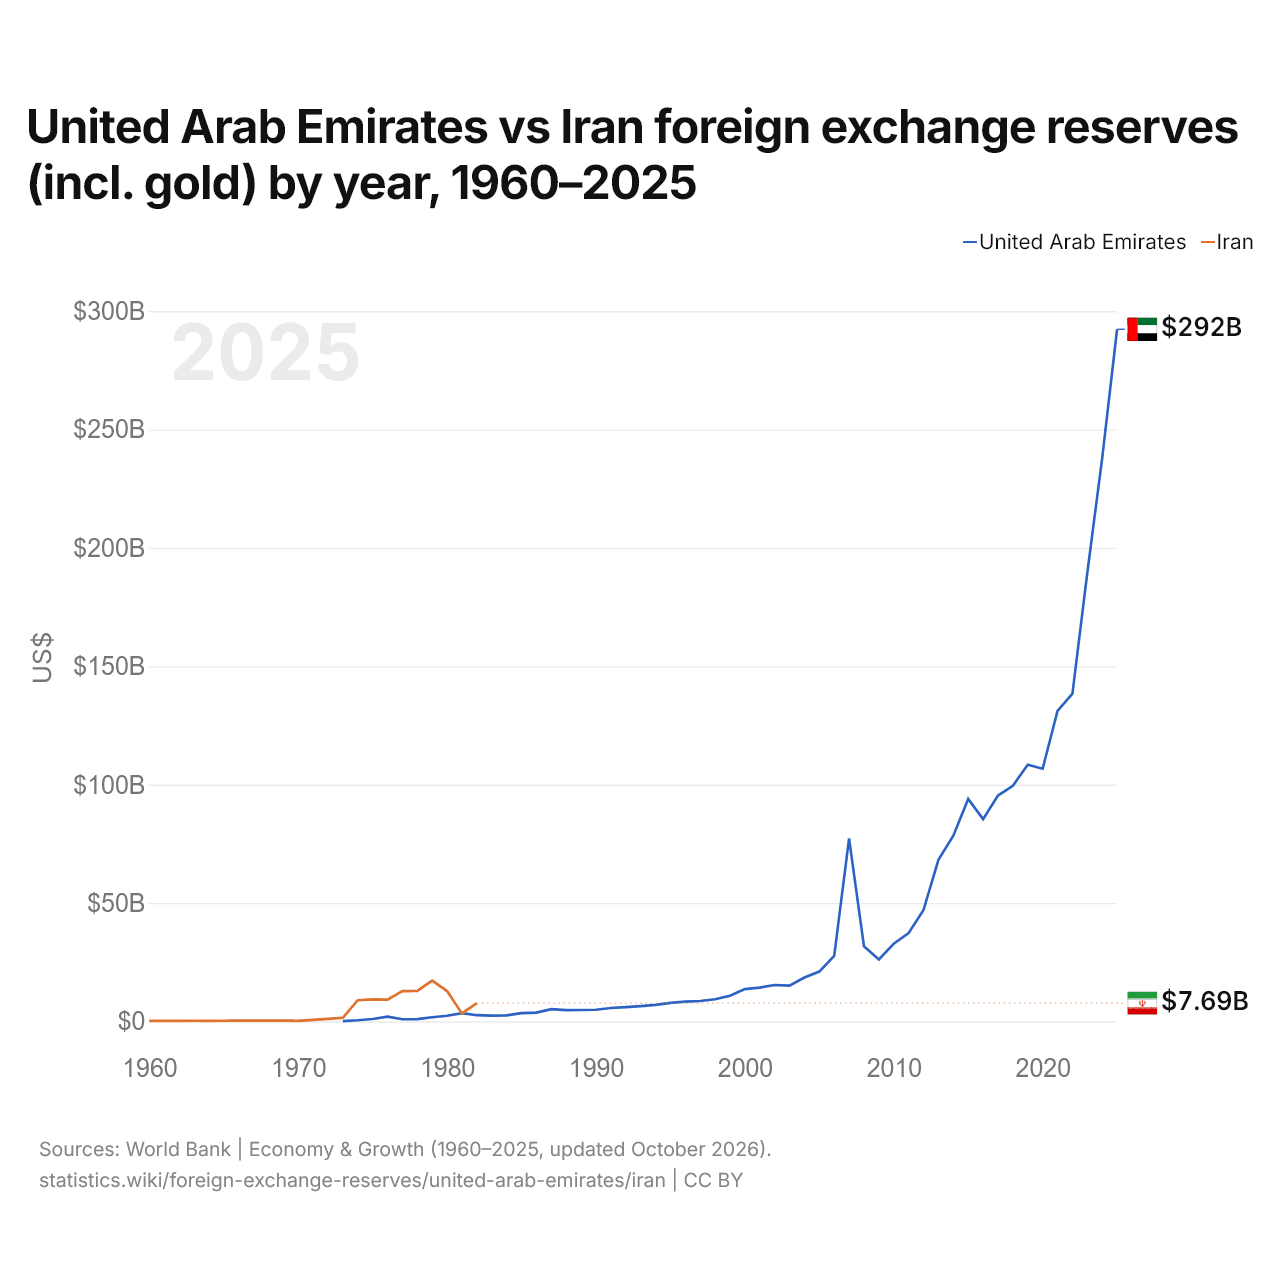
Emirados Árabes Unidos vs Irã: reservas internacionais (incluindo ouro) por ano, 1960–2025
1x
| Ano | US$ | |
|---|---|---|
 EAU |
 Irã |
|
| 2025 | US$ 292.319.262.021 | - |
| 2024 | US$ 237.931.339.945 | - |
| 2023 | US$ 189.490.945.175 | - |
| 2022 | US$ 138.433.303.845 | - |
| 2021 | US$ 131.116.705.892 | - |
| 2020 | US$ 106.701.571.777 | - |
| 2019 | US$ 108.359.358.452 | - |
| 2018 | US$ 99.503.335.479 | - |
| 2017 | US$ 95.377.648.626 | - |
| 2016 | US$ 85.390.832.746 | - |
| 2015 | US$ 93.929.134.196 | - |
| 2014 | US$ 78.424.381.665 | - |
| 2013 | US$ 68.202.650.660 | - |
| 2012 | US$ 47.035.150.431 | - |
| 2011 | US$ 37.269.318.423 | - |
| 2010 | US$ 32.785.291.883 | - |
| 2009 | US$ 26.104.201.598 | - |
| 2008 | US$ 31.694.454.694 | - |
| 2007 | US$ 77.238.765.358 | - |
| 2006 | US$ 27.617.445.823 | - |
| 2005 | US$ 21.010.295.842 | - |
| 2004 | US$ 18.529.923.698 | - |
| 2003 | US$ 15.087.811.904 | - |
| 2002 | US$ 15.355.431.325 | - |
| 2001 | US$ 14.256.130.113 | - |
| 2000 | US$ 13.631.620.189 | - |
| 1999 | US$ 10.790.300.349 | - |
| 1998 | US$ 9.305.872.456 | - |
| 1997 | US$ 8.603.051.266 | - |
| 1996 | US$ 8.350.159.124 | - |
| 1995 | US$ 7.778.376.181 | - |
| 1994 | US$ 6.963.509.610 | - |
| 1993 | US$ 6.415.331.635 | - |
| 1992 | US$ 5.977.160.986 | - |
| 1991 | US$ 5.646.813.747 | - |
| 1990 | US$ 4.890.564.527 | - |
| 1989 | US$ 4.776.310.582 | - |
| 1988 | US$ 4.768.739.333 | - |
| 1987 | US$ 5.120.925.343 | - |
| 1986 | US$ 3.689.328.863 | - |
| 1985 | US$ 3.471.498.477 | - |
| 1984 | US$ 2.538.886.189 | - |
| 1983 | US$ 2.384.157.754 | - |
| 1982 | US$ 2.588.863.920 | US$ 7.685.456.407 |
| 1981 | US$ 3.471.503.445 | US$ 3.331.695.372 |
| 1980 | US$ 2.354.590.964 | US$ 12.783.023.465 |
| 1979 | US$ 1.727.429.508 | US$ 17.207.747.367 |
| 1978 | US$ 942.089.887 | US$ 12.840.645.493 |
| 1977 | US$ 894.066.095 | US$ 12.729.171.532 |
| 1976 | US$ 1.979.903.726 | US$ 9.184.961.807 |
| 1975 | US$ 987.879.902 | US$ 9.267.871.108 |
| 1974 | US$ 452.878.021 | US$ 8.920.357.632 |
| 1973 | US$ 91.723.795 | US$ 1.498.630.790 |
| 1972 | - | US$ 1.061.180.295 |
| 1971 | - | US$ 642.577.379 |
| 1970 | - | US$ 216.875.910 |
| 1969 | - | US$ 310.902.800 |
| 1968 | - | US$ 322.136.600 |
| 1967 | - | US$ 325.062.800 |
| 1966 | - | US$ 268.925.660 |
| 1965 | - | US$ 251.965.520 |
| 1964 | - | US$ 191.508.480 |
| 1963 | - | US$ 241.829.560 |
| 1962 | - | US$ 210.768.020 |
| 1961 | - | US$ 209.547.100 |
| 1960 | - | US$ 185.218.400 |
As reservas internacionais dos Emirados Árabes Unidos são de US$ 292 bilhões (2025), e as do Irã, de US$ 7,69 bilhões (1982). Em 1973, as reservas do Irã foram 16 vezes maiores: US$ 91,7 milhões dos Emirados Árabes Unidos e US$ 1,5 bilhão do Irã.
Emirados Árabes Unidos vs Irã: reservas, incluindo ouro, e meses de importações cobertos
|
EAU
|
Irã
|
|
|---|---|---|
| Reservas, incluindo ouro | US$ 292 bi (2025) | US$ 7,69 bi (1982) |
| Meses de importações | 4,7 (2023) | 3,5 (1982) |
| Posição mundial | 14/168 | Sem classificação |
Comparar as reservas internacionais de 2 países quaisquer
Fontes:
- Banco Mundial | Economy & Growth (1960–2025, atualizado em outubro de 2026)
Creative Commons Atribuição (CC BY): você pode copiar, compartilhar, adaptar e reutilizar este conteúdo, inclusive para fins comerciais, desde que cite o statistics.wiki e indique as alterações que fizer. As fontes listadas acima podem ter suas próprias condições de licença.