
Jordânia vs Irã: reservas internacionais (incluindo ouro) por ano, 1960–2025
1x
| Ano | US$ | |
|---|---|---|
 Jordânia |
 Irã |
|
| 2025 | US$ 26.557.371.378 | - |
| 2024 | US$ 21.939.099.362 | - |
| 2023 | US$ 19.068.901.691 | - |
| 2022 | US$ 18.198.223.674 | - |
| 2021 | US$ 19.089.364.754 | - |
| 2020 | US$ 16.961.505.362 | - |
| 2019 | US$ 15.400.591.353 | - |
| 2018 | US$ 14.580.237.972 | - |
| 2017 | US$ 15.571.115.321 | - |
| 2016 | US$ 15.543.454.210 | - |
| 2015 | US$ 16.571.894.983 | - |
| 2014 | US$ 16.047.206.177 | - |
| 2013 | US$ 13.826.035.948 | - |
| 2012 | US$ 8.830.598.045 | - |
| 2011 | US$ 12.094.960.533 | - |
| 2010 | US$ 13.632.983.538 | - |
| 2009 | US$ 12.135.159.071 | - |
| 2008 | US$ 8.918.475.754 | - |
| 2007 | US$ 7.924.938.971 | - |
| 2006 | US$ 6.982.163.598 | - |
| 2005 | US$ 5.461.160.796 | - |
| 2004 | US$ 5.446.636.728 | - |
| 2003 | US$ 5.365.764.579 | - |
| 2002 | US$ 4.116.412.745 | - |
| 2001 | US$ 3.174.221.853 | - |
| 2000 | US$ 3.441.302.675 | - |
| 1999 | US$ 2.770.018.266 | - |
| 1998 | US$ 1.988.259.782 | - |
| 1997 | US$ 2.435.932.080 | - |
| 1996 | US$ 2.054.682.672 | - |
| 1995 | US$ 2.279.459.582 | - |
| 1994 | US$ 1.996.868.732 | - |
| 1993 | US$ 1.946.380.520 | - |
| 1992 | US$ 1.030.115.564 | - |
| 1991 | US$ 1.104.763.223 | - |
| 1990 | US$ 1.138.743.540 | - |
| 1989 | US$ 770.634.412 | - |
| 1988 | US$ 414.369.578 | - |
| 1987 | US$ 909.726.819 | - |
| 1986 | US$ 853.055.559 | - |
| 1985 | US$ 769.724.329 | - |
| 1984 | US$ 841.785.311 | - |
| 1983 | US$ 1.239.990.117 | - |
| 1982 | US$ 1.377.509.701 | US$ 7.685.456.407 |
| 1981 | US$ 1.510.813.968 | US$ 3.331.695.372 |
| 1980 | US$ 1.744.684.398 | US$ 12.783.023.465 |
| 1979 | US$ 1.583.911.655 | US$ 17.207.747.367 |
| 1978 | US$ 1.068.844.178 | US$ 12.840.645.493 |
| 1977 | US$ 776.098.876 | US$ 12.729.171.532 |
| 1976 | US$ 578.862.216 | US$ 9.184.961.807 |
| 1975 | US$ 570.673.411 | US$ 9.267.871.108 |
| 1974 | US$ 461.452.944 | US$ 8.920.357.632 |
| 1973 | US$ 360.195.580 | US$ 1.498.630.790 |
| 1972 | US$ 292.676.198 | US$ 1.061.180.295 |
| 1971 | US$ 257.685.715 | US$ 642.577.379 |
| 1970 | US$ 257.533.890 | US$ 216.875.910 |
| 1969 | US$ 262.689.200 | US$ 310.902.800 |
| 1968 | US$ 290.247.400 | US$ 322.136.600 |
| 1967 | US$ 244.064.400 | US$ 325.062.800 |
| 1966 | US$ 167.673.430 | US$ 268.925.660 |
| 1965 | US$ 139.846.640 | US$ 251.965.520 |
| 1964 | US$ 77.080.000 | US$ 191.508.480 |
| 1963 | US$ 62.660.000 | US$ 241.829.560 |
| 1962 | US$ 58.050.000 | US$ 210.768.020 |
| 1961 | US$ 51.230.000 | US$ 209.547.100 |
| 1960 | US$ 46.380.000 | US$ 185.218.400 |
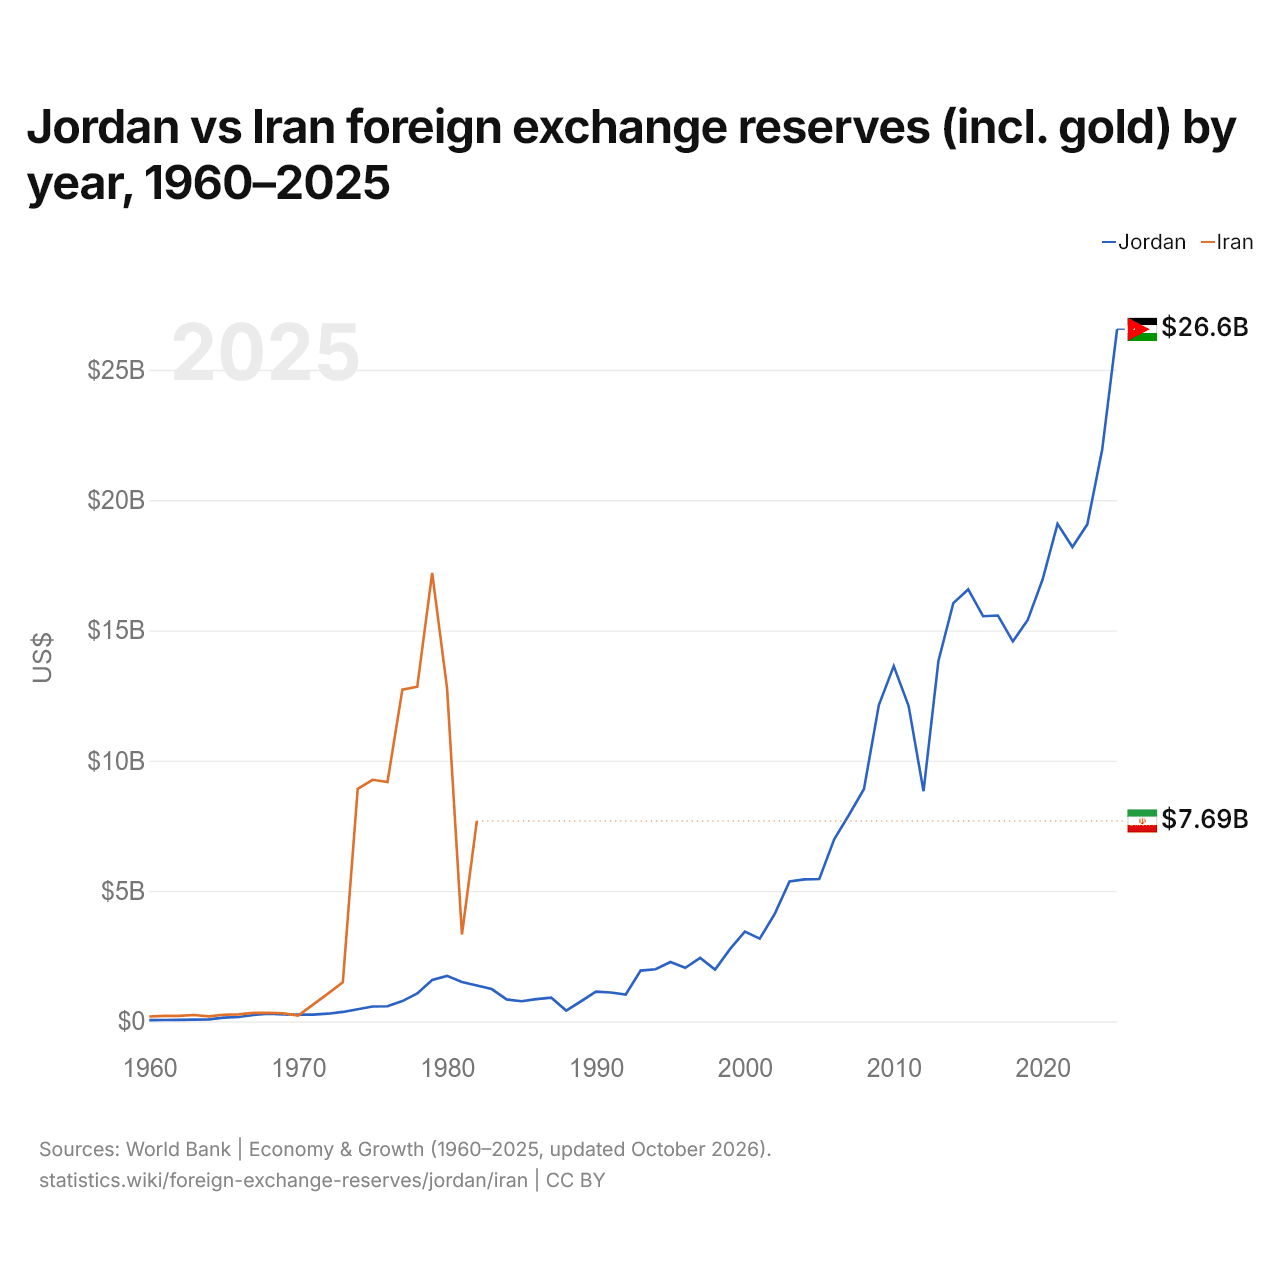
As reservas internacionais da Jordânia são de US$ 26,6 bilhões (2025), e as do Irã, de US$ 7,69 bilhões (1982). Em 1960, as reservas do Irã foram 4,0 vezes maiores: US$ 46,4 milhões da Jordânia e US$ 185 milhões do Irã.
As reservas internacionais do Irã têm sido maiores que as da Jordânia todos os anos desde 1971.
Jordânia vs Irã: reservas, incluindo ouro, e meses de importações cobertos
|
Jordânia
|
Irã
|
|
|---|---|---|
| Reservas, incluindo ouro | US$ 26,6 bi (2025) | US$ 7,69 bi (1982) |
| Meses de importações | 7,9 (2024) | 3,5 (1982) |
| Posição mundial | 61/168 | Sem classificação |
Comparar as reservas internacionais de 2 países quaisquer
Fontes:
- Banco Mundial | Economy & Growth (1960–2025, atualizado em outubro de 2026)
Creative Commons Atribuição (CC BY): você pode copiar, compartilhar, adaptar e reutilizar este conteúdo, inclusive para fins comerciais, desde que cite o statistics.wiki e indique as alterações que fizer. As fontes listadas acima podem ter suas próprias condições de licença.