
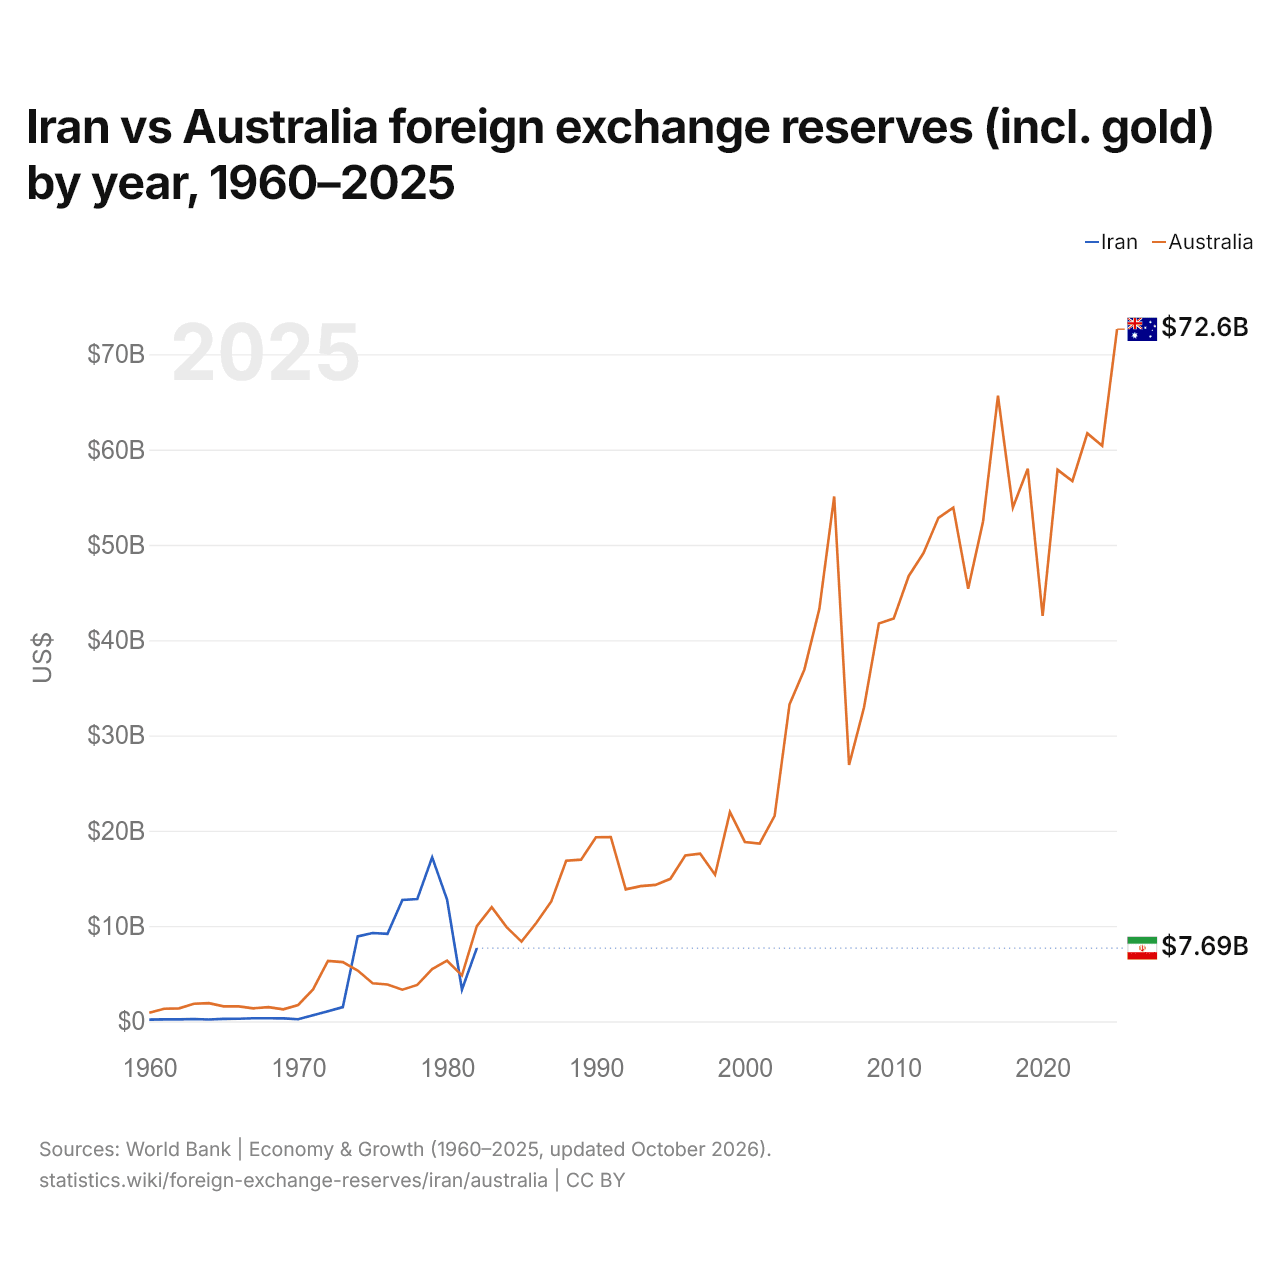
Irã vs Austrália: reservas internacionais (incluindo ouro) por ano, 1960–2025
1x
| Ano | US$ | |
|---|---|---|
 Irã |
 Austrália |
|
| 2025 | - | US$ 72.632.706.750 |
| 2024 | - | US$ 60.404.058.269 |
| 2023 | - | US$ 61.703.347.652 |
| 2022 | - | US$ 56.701.901.830 |
| 2021 | - | US$ 57.877.502.314 |
| 2020 | - | US$ 42.544.629.265 |
| 2019 | - | US$ 57.994.685.703 |
| 2018 | - | US$ 53.909.533.420 |
| 2017 | - | US$ 65.653.718.118 |
| 2016 | - | US$ 52.480.791.523 |
| 2015 | - | US$ 45.406.035.071 |
| 2014 | - | US$ 53.910.325.023 |
| 2013 | - | US$ 52.837.027.750 |
| 2012 | - | US$ 49.138.172.006 |
| 2011 | - | US$ 46.714.016.758 |
| 2010 | - | US$ 42.267.797.177 |
| 2009 | - | US$ 41.742.190.607 |
| 2008 | - | US$ 32.923.506.492 |
| 2007 | - | US$ 26.907.894.339 |
| 2006 | - | US$ 55.078.716.458 |
| 2005 | - | US$ 43.257.063.109 |
| 2004 | - | US$ 36.925.537.509 |
| 2003 | - | US$ 33.258.076.239 |
| 2002 | - | US$ 21.567.012.300 |
| 2001 | - | US$ 18.663.980.677 |
| 2000 | - | US$ 18.821.546.024 |
| 1999 | - | US$ 21.955.814.712 |
| 1998 | - | US$ 15.377.553.385 |
| 1997 | - | US$ 17.588.261.224 |
| 1996 | - | US$ 17.402.141.302 |
| 1995 | - | US$ 14.951.886.130 |
| 1994 | - | US$ 14.313.163.753 |
| 1993 | - | US$ 14.188.550.691 |
| 1992 | - | US$ 13.852.416.773 |
| 1991 | - | US$ 19.339.711.736 |
| 1990 | - | US$ 19.318.743.724 |
| 1989 | - | US$ 16.961.258.793 |
| 1988 | - | US$ 16.852.981.546 |
| 1987 | - | US$ 12.583.630.027 |
| 1986 | - | US$ 10.346.341.272 |
| 1985 | - | US$ 8.361.034.037 |
| 1984 | - | US$ 9.886.483.620 |
| 1983 | - | US$ 11.987.781.860 |
| 1982 | US$ 7.685.456.407 | US$ 9.995.391.403 |
| 1981 | US$ 3.331.695.372 | US$ 4.824.242.557 |
| 1980 | US$ 12.783.023.465 | US$ 6.366.460.013 |
| 1979 | US$ 17.207.747.367 | US$ 5.486.014.814 |
| 1978 | US$ 12.840.645.493 | US$ 3.822.366.657 |
| 1977 | US$ 12.729.171.532 | US$ 3.319.307.783 |
| 1976 | US$ 9.184.961.807 | US$ 3.862.096.210 |
| 1975 | US$ 9.267.871.108 | US$ 3.989.818.897 |
| 1974 | US$ 8.920.357.632 | US$ 5.329.033.239 |
| 1973 | US$ 1.498.630.790 | US$ 6.213.814.800 |
| 1972 | US$ 1.061.180.295 | US$ 6.339.772.676 |
| 1971 | US$ 642.577.379 | US$ 3.357.977.441 |
| 1970 | US$ 216.875.910 | US$ 1.708.729.730 |
| 1969 | US$ 310.902.800 | US$ 1.262.842.800 |
| 1968 | US$ 322.136.600 | US$ 1.493.121.700 |
| 1967 | US$ 325.062.800 | US$ 1.365.680.000 |
| 1966 | US$ 268.925.660 | US$ 1.569.256.000 |
| 1965 | US$ 251.965.520 | US$ 1.565.328.400 |
| 1964 | US$ 191.508.480 | US$ 1.906.895.200 |
| 1963 | US$ 241.829.560 | US$ 1.842.726.000 |
| 1962 | US$ 210.768.020 | US$ 1.358.960.800 |
| 1961 | US$ 209.547.100 | US$ 1.320.041.500 |
| 1960 | US$ 185.218.400 | US$ 892.782.000 |
As reservas internacionais do Irã são de US$ 7,69 bilhões (1982), e as da Austrália, de US$ 72,6 bilhões (2025). Em 1960, as reservas da Austrália foram 4,8 vezes maiores: US$ 185 milhões do Irã e US$ 893 milhões da Austrália.
Irã vs Austrália: reservas, incluindo ouro, e meses de importações cobertos
|
Irã
|
Austrália
|
|
|---|---|---|
| Reservas, incluindo ouro | US$ 7,69 bi (1982) | US$ 72,6 bi (2025) |
| Meses de importações | 3,5 (1982) | 2,1 (2025) |
| Posição mundial | Sem classificação | 38/168 |
Comparar as reservas internacionais de 2 países quaisquer
Fontes:
- Banco Mundial | Economy & Growth (1960–2025, atualizado em outubro de 2026)
Creative Commons Atribuição (CC BY): você pode copiar, compartilhar, adaptar e reutilizar este conteúdo, inclusive para fins comerciais, desde que cite o statistics.wiki e indique as alterações que fizer. As fontes listadas acima podem ter suas próprias condições de licença.