
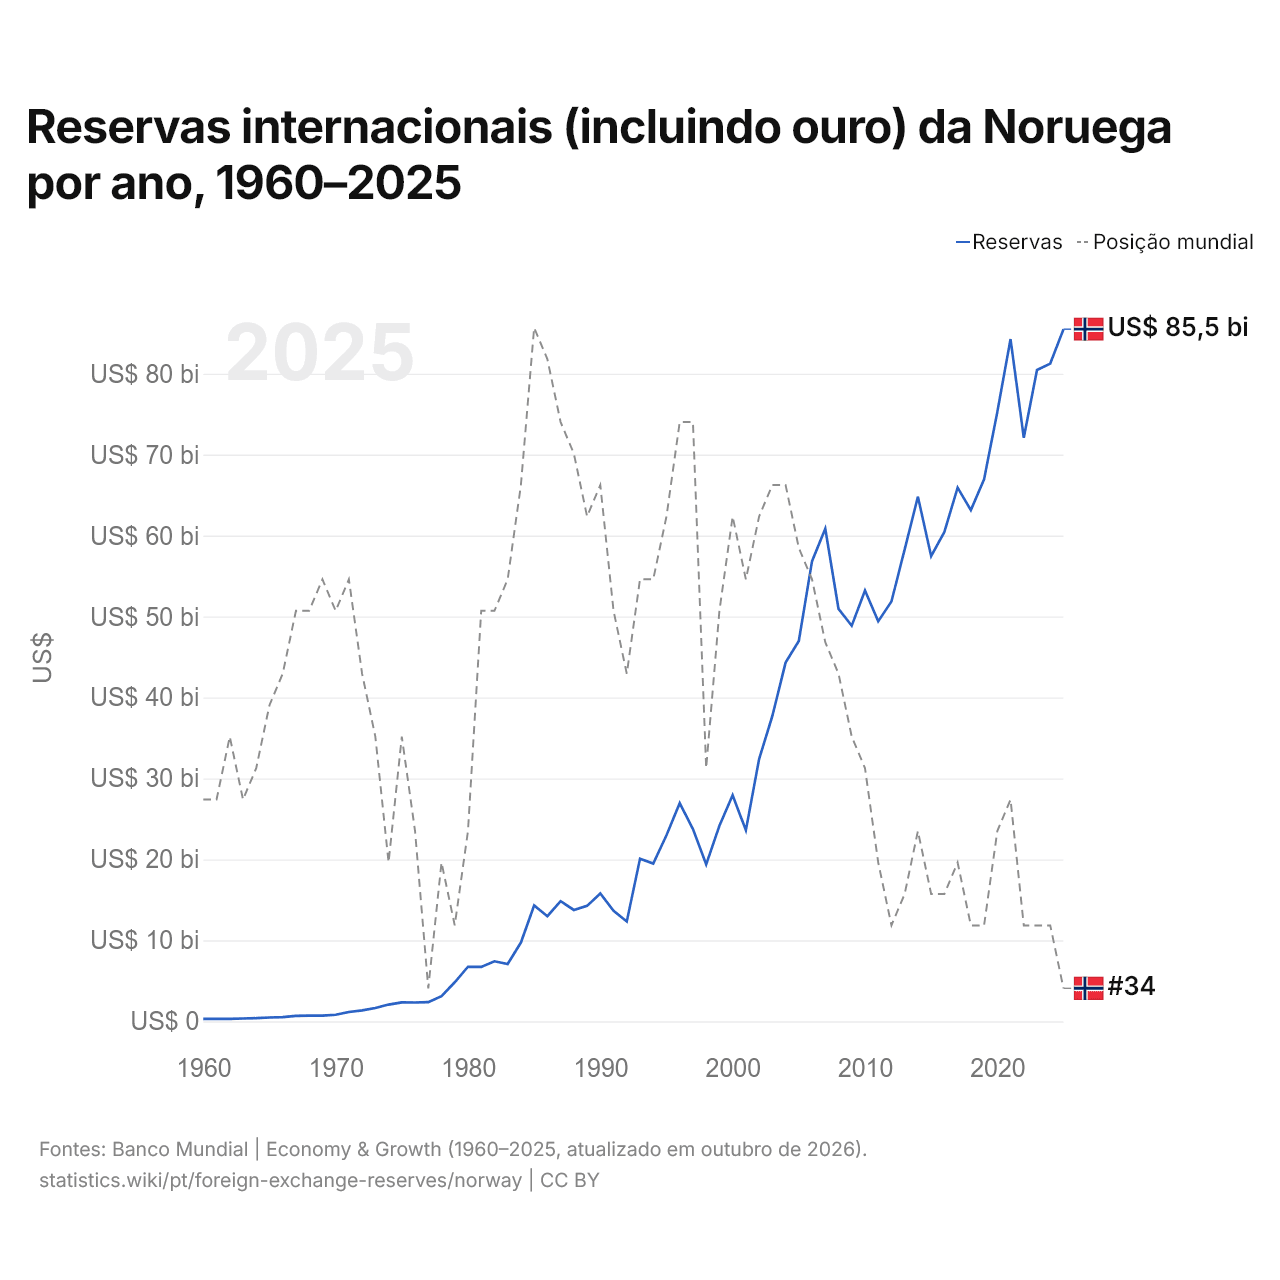
Reservas internacionais (incluindo ouro) da Noruega por ano, 1960–2025
| Ano | US$ | Posição mundial |
|---|---|---|
| Reservas | ||
| 2025 | US$ 85.494.772.694 | #34 |
| 2024 | US$ 81.241.559.662 | #32 |
| 2023 | US$ 80.459.096.008 | #32 |
| 2022 | US$ 72.077.375.479 | #32 |
| 2021 | US$ 84.270.941.751 | #28 |
| 2020 | US$ 75.258.813.465 | #29 |
| 2019 | US$ 66.946.037.550 | #32 |
| 2018 | US$ 63.145.471.060 | #32 |
| 2017 | US$ 65.923.863.904 | #30 |
| 2016 | US$ 60.445.172.370 | #31 |
| 2015 | US$ 57.455.936.482 | #31 |
| 2014 | US$ 64.800.723.857 | #29 |
| 2013 | US$ 58.283.142.155 | #31 |
| 2012 | US$ 51.856.399.588 | #32 |
| 2011 | US$ 49.397.087.253 | #30 |
| 2010 | US$ 53.215.083.706 | #27 |
| 2009 | US$ 48.859.300.062 | #26 |
| 2008 | US$ 50.949.819.415 | #24 |
| 2007 | US$ 60.839.629.829 | #23 |
| 2006 | US$ 56.841.568.846 | #21 |
| 2005 | US$ 46.985.905.052 | #20 |
| 2004 | US$ 44.307.531.918 | #18 |
| 2003 | US$ 37.712.335.260 | #18 |
| 2002 | US$ 32.404.966.343 | #19 |
| 2001 | US$ 23.604.634.336 | #21 |
| 2000 | US$ 27.922.060.282 | #19 |
| 1999 | US$ 24.150.928.580 | #22 |
| 1998 | US$ 19.388.853.820 | #27 |
| 1997 | US$ 23.743.940.555 | #16 |
| 1996 | US$ 26.953.896.228 | #16 |
| 1995 | US$ 22.975.738.604 | #19 |
| 1994 | US$ 19.479.286.660 | #21 |
| 1993 | US$ 20.084.954.186 | #21 |
| 1992 | US$ 12.334.939.898 | #24 |
| 1991 | US$ 13.650.691.818 | #22 |
| 1990 | US$ 15.788.119.114 | #18 |
| 1989 | US$ 14.259.623.107 | #19 |
| 1988 | US$ 13.753.480.639 | #17 |
| 1987 | US$ 14.849.725.175 | #16 |
| 1986 | US$ 12.987.382.962 | #14 |
| 1985 | US$ 14.303.907.455 | #13 |
| 1984 | US$ 9.730.069.918 | #18 |
| 1983 | US$ 7.080.876.679 | #21 |
| 1982 | US$ 7.414.476.975 | #22 |
| 1981 | US$ 6.723.509.093 | #22 |
| 1980 | US$ 6.745.966.631 | #29 |
| 1979 | US$ 4.821.442.649 | #32 |
| 1978 | US$ 3.116.741.416 | #30 |
| 1977 | US$ 2.373.917.180 | #34 |
| 1976 | US$ 2.321.348.340 | #29 |
| 1975 | US$ 2.333.773.000 | #26 |
| 1974 | US$ 2.069.214.569 | #30 |
| 1973 | US$ 1.643.357.567 | #26 |
| 1972 | US$ 1.351.223.544 | #24 |
| 1971 | US$ 1.159.714.543 | #21 |
| 1970 | US$ 812.917.900 | #22 |
| 1969 | US$ 710.409.600 | #21 |
| 1968 | US$ 707.150.100 | #22 |
| 1967 | US$ 677.214.400 | #22 |
| 1966 | US$ 527.729.180 | #24 |
| 1965 | US$ 476.020.480 | #25 |
| 1964 | US$ 387.005.120 | #27 |
| 1963 | US$ 353.954.840 | #28 |
| 1962 | US$ 303.975.970 | #26 |
| 1961 | US$ 303.430.200 | #28 |
| 1960 | US$ 308.178.400 | #28 |
Em 2025, as reservas internacionais da Noruega foram de US$ 85,5 bilhões, ante US$ 308 milhões em 1960. O mínimo foi de US$ 303 milhões, em 1961. Foram as 34ª maiores do mundo; em 2024, eram as 32ª. Sua melhor posição foi o 13º lugar, ocupado pela última vez em 1985.
Em 2025, as reservas internacionais da Noruega foram as 13ª maiores de 41 países da Europa. Em 2025, as reservas da Noruega equivaliam a 5,7 meses de suas importações de bens e serviços, ante 5,5 meses em 2015.
A Noruega na classificação mundial das reservas internacionais (incluindo ouro), 2025







Comparar as reservas internacionais da Noruega com as de outros países
Fontes:
- Banco Mundial | Economy & Growth (1960–2025, atualizado em outubro de 2026)
Creative Commons Atribuição (CC BY): você pode copiar, compartilhar, adaptar e reutilizar este conteúdo, inclusive para fins comerciais, desde que cite o statistics.wiki e indique as alterações que fizer. As fontes listadas acima podem ter suas próprias condições de licença.