
Thailand vs Italy carbon intensity of GDP (kg CO2 per $, PPP, 2021 prices)
1x
| Year | kg CO2 per $ | |
|---|---|---|
 Thailand |
 Italy |
|
| 2024 | 0.181 kg | 0.095 kg |
| 2023 | 0.181 kg | 0.098 kg |
| 2022 | 0.191 kg | 0.107 kg |
| 2021 | 0.185 kg | 0.112 kg |
| 2020 | 0.193 kg | 0.109 kg |
| 2019 | 0.188 kg | 0.112 kg |
| 2018 | 0.186 kg | 0.115 kg |
| 2017 | 0.197 kg | 0.118 kg |
| 2016 | 0.202 kg | 0.121 kg |
| 2015 | 0.212 kg | 0.124 kg |
| 2014 | 0.212 kg | 0.121 kg |
| 2013 | 0.217 kg | 0.128 kg |
| 2012 | 0.213 kg | 0.137 kg |
| 2011 | 0.213 kg | 0.14 kg |
| 2010 | 0.215 kg | 0.144 kg |
| 2009 | 0.217 kg | 0.142 kg |
| 2008 | 0.222 kg | 0.152 kg |
| 2007 | 0.225 kg | 0.155 kg |
| 2006 | 0.232 kg | 0.16 kg |
| 2005 | 0.24 kg | 0.164 kg |
| 2004 | 0.241 kg | 0.165 kg |
| 2003 | 0.235 kg | 0.164 kg |
| 2002 | 0.243 kg | 0.157 kg |
| 2001 | 0.242 kg | 0.155 kg |
| 2000 | 0.239 kg | 0.158 kg |
| 1999 | 0.249 kg | 0.163 kg |
| 1998 | 0.249 kg | 0.163 kg |
| 1997 | 0.258 kg | 0.163 kg |
| 1996 | 0.246 kg | 0.164 kg |
| 1995 | 0.231 kg | 0.168 kg |
| 1994 | 0.221 kg | 0.164 kg |
| 1993 | 0.214 kg | 0.169 kg |
| 1992 | 0.204 kg | 0.171 kg |
| 1991 | 0.201 kg | 0.173 kg |
| 1990 | 0.2 kg | 0.176 kg |
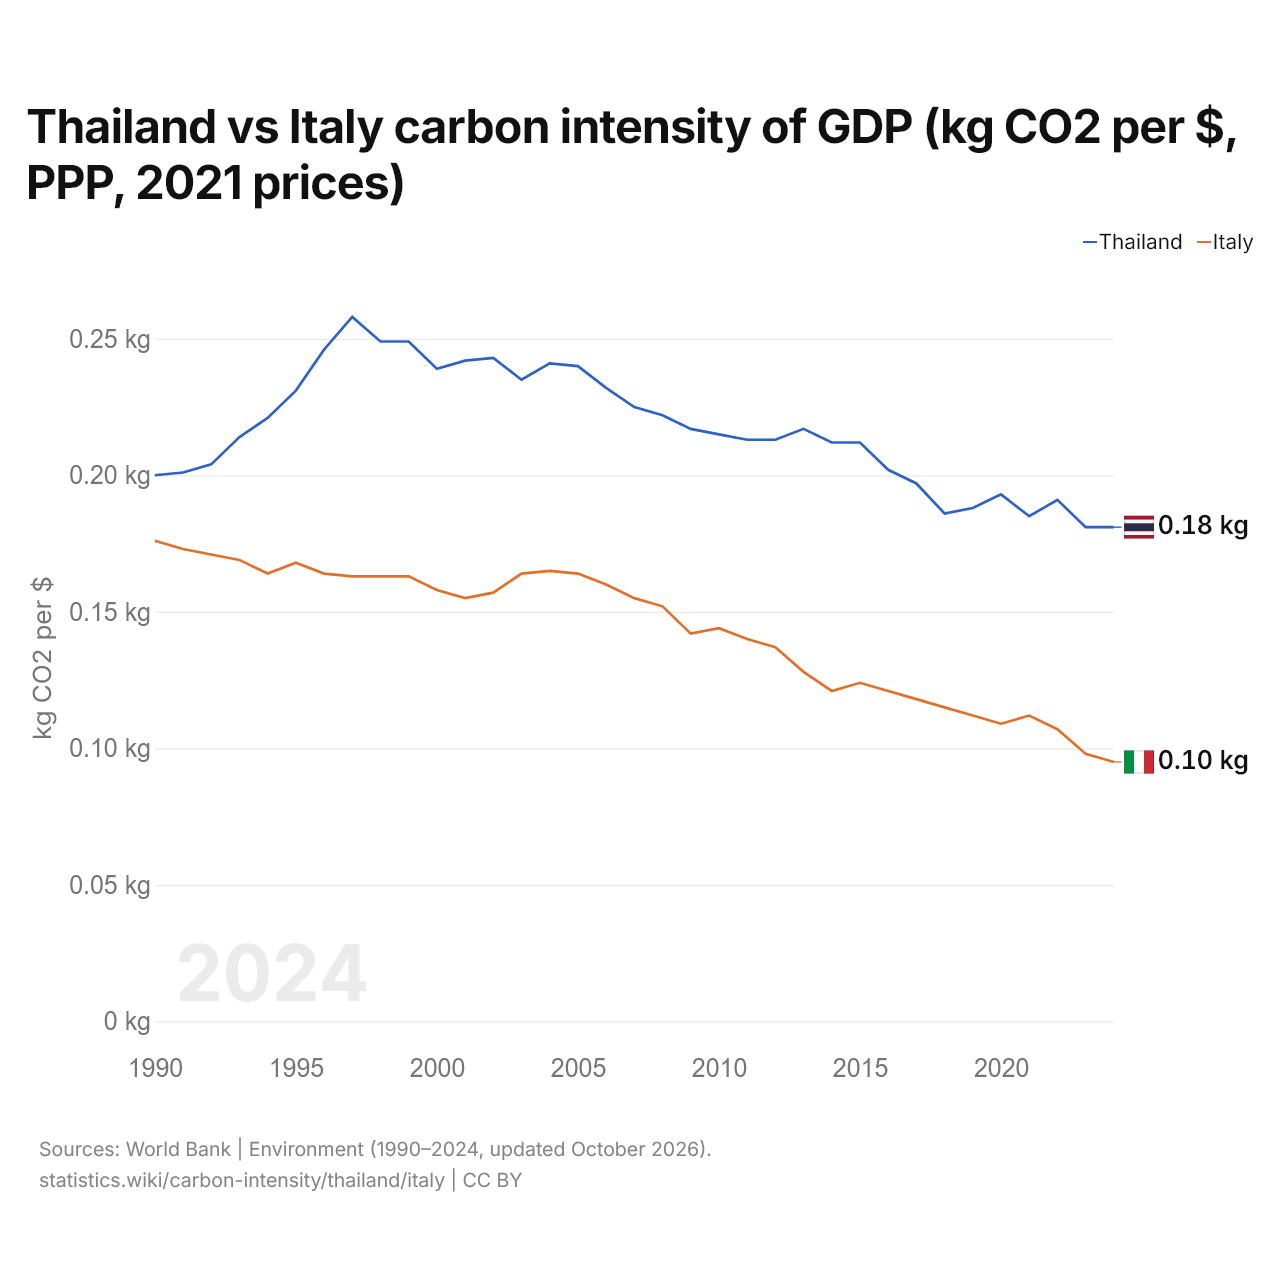
Carbon intensity is 0.181 kg of CO2 per dollar of GDP in Thailand and 0.095 kg in Italy: 0.086 kg more in Thailand. In 1990, Thailand emitted 0.200 kg and Italy 0.176 kg, a difference of 0.024 kg.
Thailand's carbon intensity has been higher than Italy's every year since 1990. The gap was widest in 1997, when Thailand's carbon intensity was 0.095 kg above Italy's.
Thailand vs Italy: latest carbon intensity of GDP
Compare the carbon intensity of GDP of any 2 countries
Sources:
- World Bank | Environment (1990–2024, updated October 2026)
Creative Commons Attribution (CC BY): you may copy, share, adapt and reuse this content, also commercially, as long as you credit statistics.wiki and note any changes you made. The sources listed above may have their own license terms.