
South Korea vs Bulgaria carbon intensity of GDP (kg CO2 per $, PPP, 2021 prices)
1x
| Year | kg CO2 per $ | |
|---|---|---|
 South Korea |
 Bulgaria |
|
| 2024 | 0.206 kg | 0.155 kg |
| 2023 | 0.211 kg | 0.173 kg |
| 2022 | 0.223 kg | 0.236 kg |
| 2021 | 0.239 kg | 0.228 kg |
| 2020 | 0.241 kg | 0.211 kg |
| 2019 | 0.254 kg | 0.231 kg |
| 2018 | 0.27 kg | 0.249 kg |
| 2017 | 0.272 kg | 0.271 kg |
| 2016 | 0.275 kg | 0.267 kg |
| 2015 | 0.281 kg | 0.291 kg |
| 2014 | 0.284 kg | 0.285 kg |
| 2013 | 0.298 kg | 0.27 kg |
| 2012 | 0.309 kg | 0.302 kg |
| 2011 | 0.319 kg | 0.334 kg |
| 2010 | 0.313 kg | 0.308 kg |
| 2009 | 0.304 kg | 0.294 kg |
| 2008 | 0.304 kg | 0.333 kg |
| 2007 | 0.306 kg | 0.374 kg |
| 2006 | 0.314 kg | 0.374 kg |
| 2005 | 0.326 kg | 0.388 kg |
| 2004 | 0.342 kg | 0.407 kg |
| 2003 | 0.348 kg | 0.45 kg |
| 2002 | 0.353 kg | 0.422 kg |
| 2001 | 0.367 kg | 0.473 kg |
| 2000 | 0.376 kg | 0.469 kg |
| 1999 | 0.379 kg | 0.511 kg |
| 1998 | 0.387 kg | 0.531 kg |
| 1997 | 0.428 kg | 0.575 kg |
| 1996 | 0.433 kg | 0.513 kg |
| 1995 | 0.436 kg | 0.537 kg |
| 1994 | 0.444 kg | 0.541 kg |
| 1993 | 0.45 kg | 0.576 kg |
| 1992 | 0.442 kg | 0.56 kg |
| 1991 | 0.428 kg | 0.544 kg |
| 1990 | 0.422 kg | 0.614 kg |
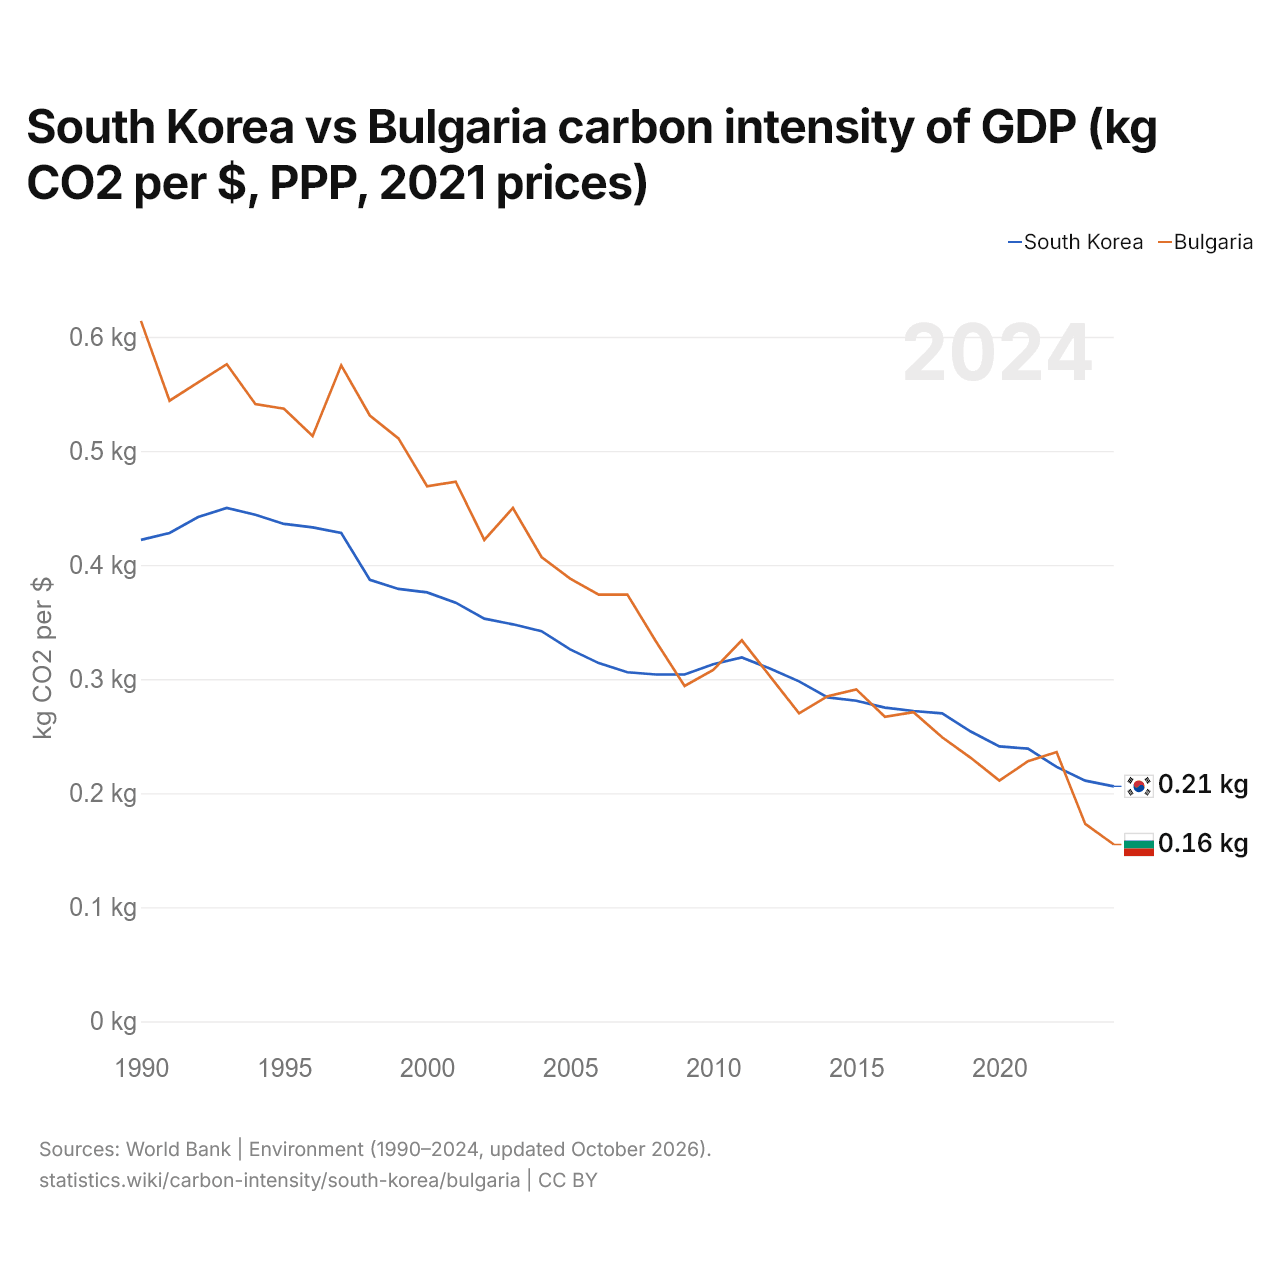
Carbon intensity is 0.206 kg of CO2 per dollar of GDP in South Korea and 0.155 kg in Bulgaria: 0.051 kg more in South Korea. In 1990, South Korea emitted 0.422 kg and Bulgaria 0.614 kg, a difference of 0.192 kg.
South Korea vs Bulgaria: latest carbon intensity of GDP
|
South Korea
|
Bulgaria
|
|
|---|---|---|
| kg CO2 per $ of GDP | 0.206 | 0.155 |
| World rank | 38/177 | 65/177 |
| Change since 1990 | −51.1% | −74.7% |
| Carbon intensity difference | 1.3× | 0.75× |
Compare the carbon intensity of GDP of any 2 countries
Sources:
- World Bank | Environment (1990–2024, updated October 2026)
Creative Commons Attribution (CC BY): you may copy, share, adapt and reuse this content, also commercially, as long as you credit statistics.wiki and note any changes you made. The sources listed above may have their own license terms.