
Somalia vs Seychelles carbon intensity of GDP (kg CO2 per $, PPP, 2021 prices)
1x
| Year | kg CO2 per $ | |
|---|---|---|
 Somalia |
 Seychelles |
|
| 2024 | 0.032 kg | 0.247 kg |
| 2023 | 0.033 kg | 0.244 kg |
| 2022 | 0.034 kg | 0.258 kg |
| 2021 | 0.034 kg | 0.265 kg |
| 2020 | 0.034 kg | 0.283 kg |
| 2019 | 0.035 kg | 0.267 kg |
| 2018 | 0.037 kg | 0.316 kg |
| 2017 | 0.037 kg | 0.381 kg |
| 2016 | 0.042 kg | 0.389 kg |
| 2015 | 0.044 kg | 0.391 kg |
| 2014 | 0.046 kg | 0.399 kg |
| 2013 | 0.051 kg | 0.36 kg |
| 2012 | 0.056 kg | 0.403 kg |
| 2011 | 0.061 kg | 0.366 kg |
| 2010 | 0.065 kg | 0.471 kg |
| 2009 | 0.068 kg | 0.547 kg |
| 2008 | 0.071 kg | 0.482 kg |
| 2007 | 0.079 kg | 0.441 kg |
| 2006 | 0.083 kg | 0.581 kg |
| 2005 | 0.085 kg | 0.584 kg |
| 2004 | 0.09 kg | 0.701 kg |
| 2003 | 0.098 kg | 0.491 kg |
| 2002 | 0.103 kg | 0.458 kg |
| 2001 | 0.1 kg | 0.512 kg |
| 2000 | 0.101 kg | 0.451 kg |
| 1999 | 0.075 kg | 0.247 kg |
| 1998 | 0.077 kg | 0.241 kg |
| 1997 | 0.08 kg | 0.241 kg |
| 1996 | 0.082 kg | 0.257 kg |
| 1995 | 0.086 kg | 0.273 kg |
| 1994 | 0.087 kg | 0.257 kg |
| 1993 | 0.071 kg | 0.252 kg |
| 1992 | 0.072 kg | 0.269 kg |
| 1991 | 0.084 kg | 0.343 kg |
| 1990 | 0.113 kg | 0.247 kg |
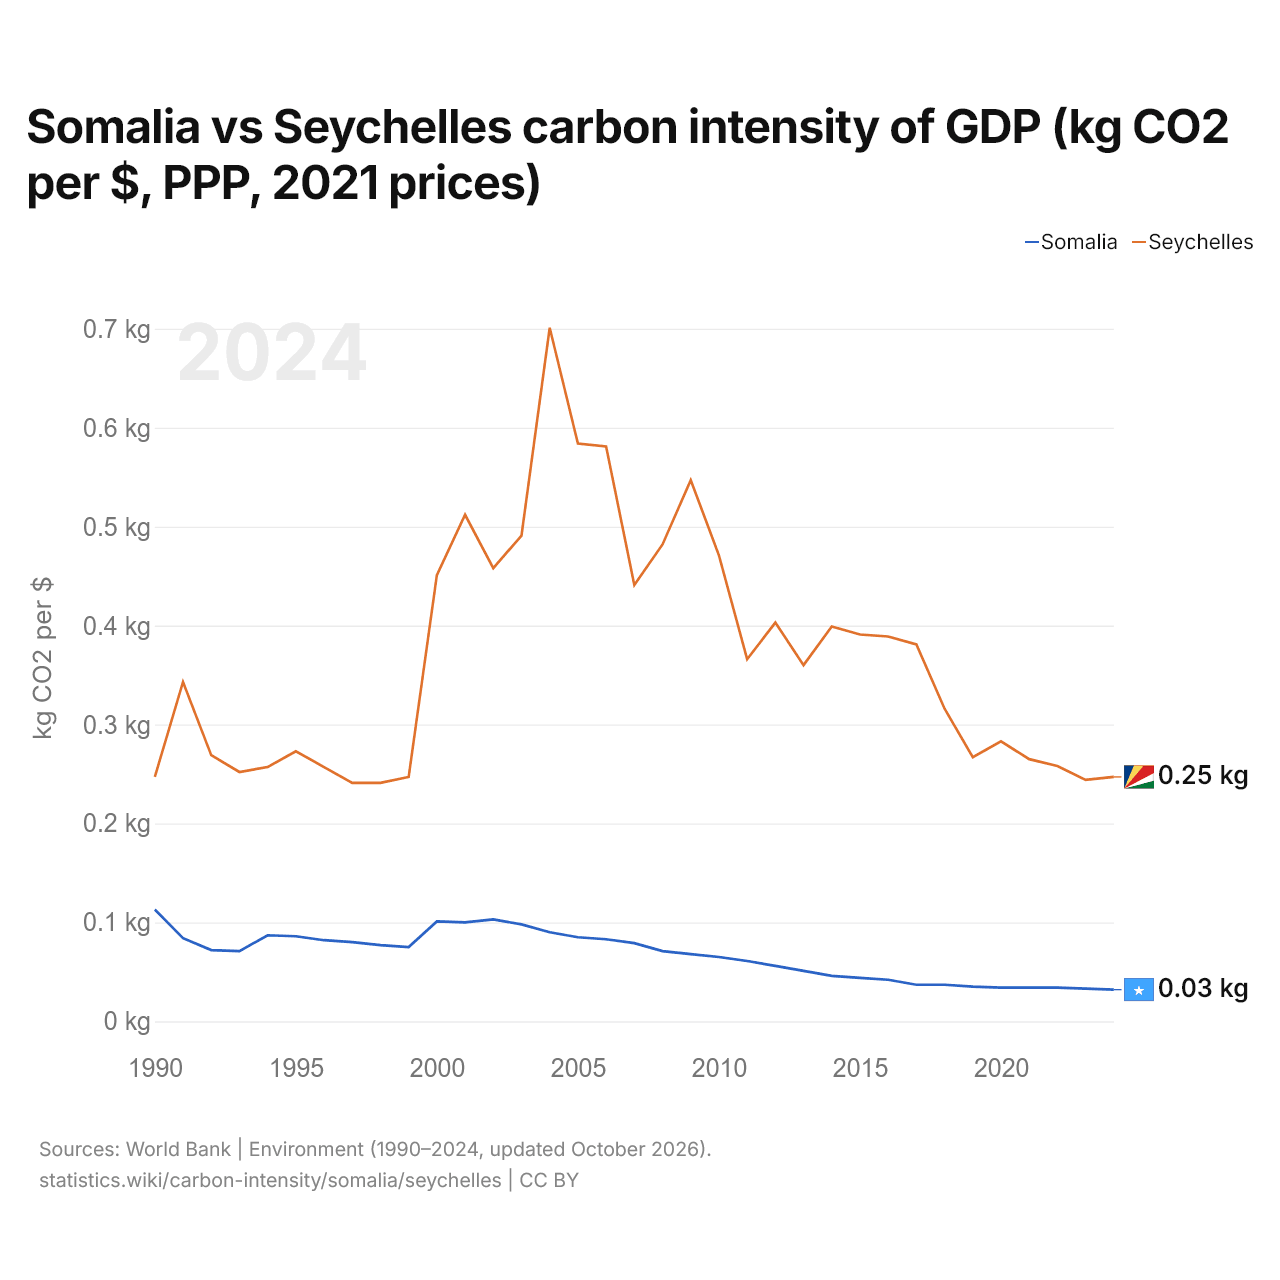
Carbon intensity is 0.032 kg of CO2 per dollar of GDP in Somalia and 0.247 kg in the Seychelles: 0.215 kg more in the Seychelles. In 1990, Somalia emitted 0.113 kg and the Seychelles 0.247 kg, a difference of 0.134 kg.
The Seychelles' carbon intensity has been higher than Somalia's every year since 1990. The gap was widest in 2004, when the Seychelles' carbon intensity was 0.611 kg above Somalia's.
Somalia vs Seychelles: latest carbon intensity of GDP
|
Somalia
|
Seychelles
|
|
|---|---|---|
| kg CO2 per $ of GDP | 0.032 | 0.247 |
| World rank | 177/177 | 25/177 |
| Change since 1990 | −71.5% | +0.0% |
| Carbon intensity difference | 0.13× | 7.7× |
Compare the carbon intensity of GDP of any 2 countries
Sources:
- World Bank | Environment (1990–2024, updated October 2026)
Creative Commons Attribution (CC BY): you may copy, share, adapt and reuse this content, also commercially, as long as you credit statistics.wiki and note any changes you made. The sources listed above may have their own license terms.