
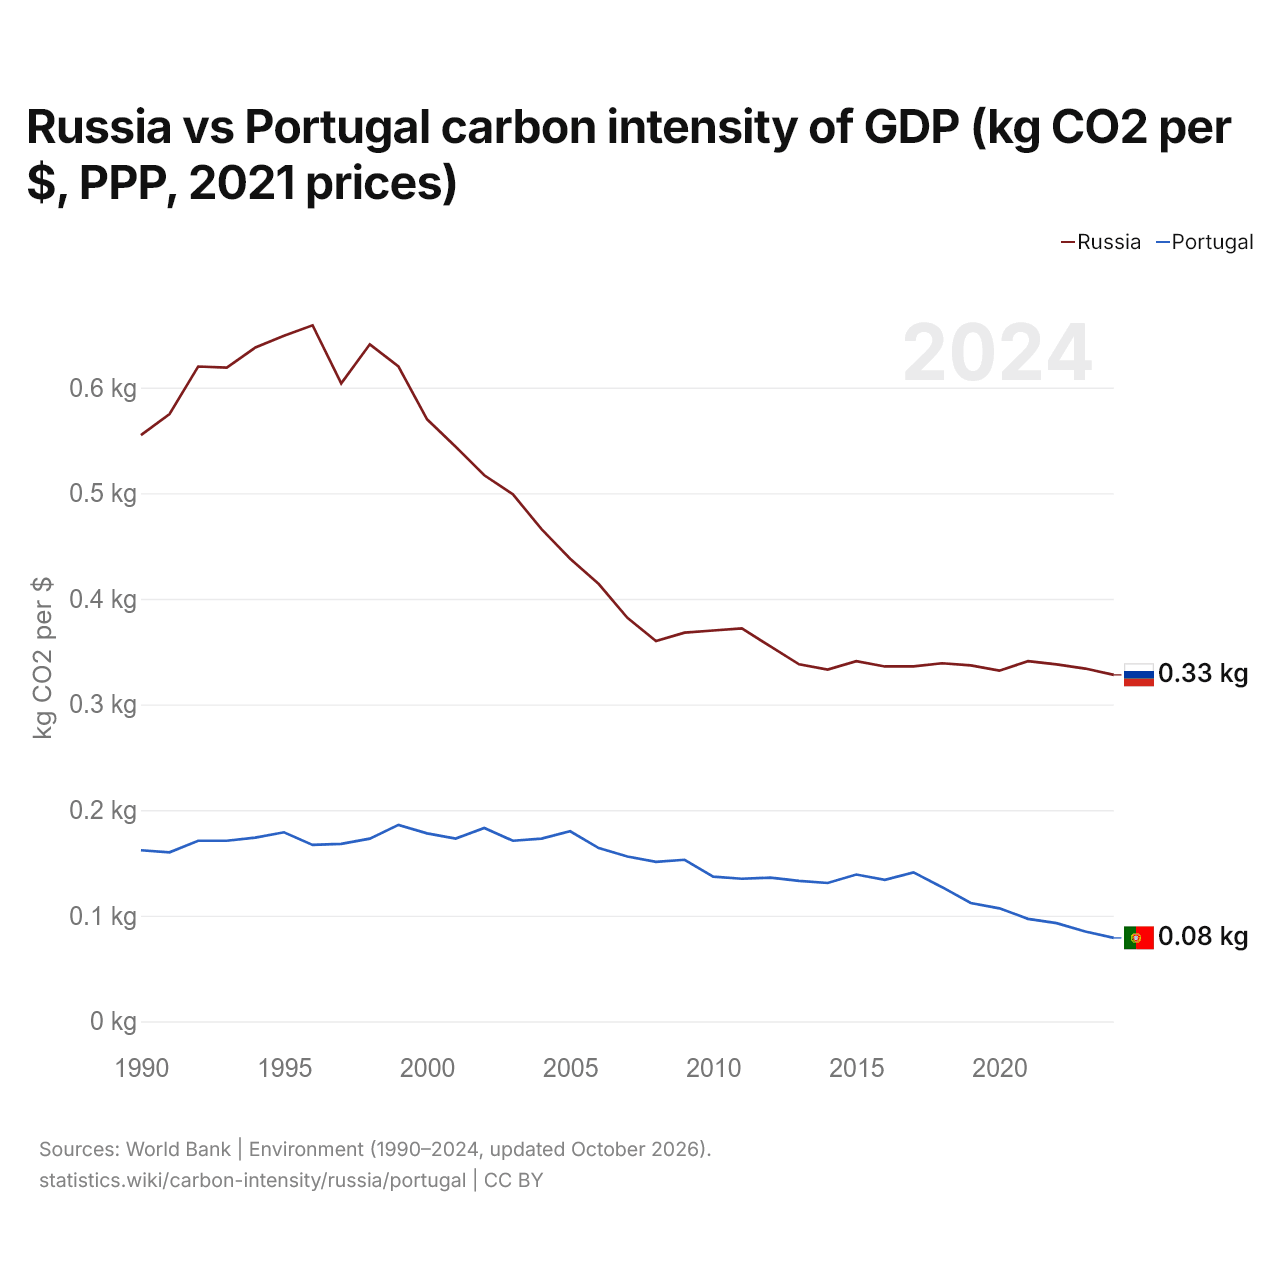
Russia vs Portugal carbon intensity of GDP (kg CO2 per $, PPP, 2021 prices)
1x
| Year | kg CO2 per $ | |
|---|---|---|
 Russia |
 Portugal |
|
| 2024 | 0.328 kg | 0.079 kg |
| 2023 | 0.334 kg | 0.085 kg |
| 2022 | 0.338 kg | 0.093 kg |
| 2021 | 0.341 kg | 0.097 kg |
| 2020 | 0.332 kg | 0.107 kg |
| 2019 | 0.337 kg | 0.112 kg |
| 2018 | 0.339 kg | 0.127 kg |
| 2017 | 0.336 kg | 0.141 kg |
| 2016 | 0.336 kg | 0.134 kg |
| 2015 | 0.341 kg | 0.139 kg |
| 2014 | 0.333 kg | 0.131 kg |
| 2013 | 0.338 kg | 0.133 kg |
| 2012 | 0.355 kg | 0.136 kg |
| 2011 | 0.372 kg | 0.135 kg |
| 2010 | 0.37 kg | 0.137 kg |
| 2009 | 0.368 kg | 0.153 kg |
| 2008 | 0.36 kg | 0.151 kg |
| 2007 | 0.382 kg | 0.156 kg |
| 2006 | 0.414 kg | 0.164 kg |
| 2005 | 0.438 kg | 0.18 kg |
| 2004 | 0.466 kg | 0.173 kg |
| 2003 | 0.499 kg | 0.171 kg |
| 2002 | 0.517 kg | 0.183 kg |
| 2001 | 0.544 kg | 0.173 kg |
| 2000 | 0.57 kg | 0.178 kg |
| 1999 | 0.62 kg | 0.186 kg |
| 1998 | 0.641 kg | 0.173 kg |
| 1997 | 0.604 kg | 0.168 kg |
| 1996 | 0.659 kg | 0.167 kg |
| 1995 | 0.649 kg | 0.179 kg |
| 1994 | 0.638 kg | 0.174 kg |
| 1993 | 0.619 kg | 0.171 kg |
| 1992 | 0.62 kg | 0.171 kg |
| 1991 | 0.575 kg | 0.16 kg |
| 1990 | 0.555 kg | 0.162 kg |
Carbon intensity is 0.328 kg of CO2 per dollar of GDP in Russia and 0.079 kg in Portugal: 0.249 kg more in Russia. In 1990, Russia emitted 0.555 kg and Portugal 0.162 kg, a difference of 0.393 kg.
Russia's carbon intensity has been higher than Portugal's every year since 1990. The gap was widest in 1996, when Russia's carbon intensity was 0.492 kg above Portugal's.
Russia vs Portugal: latest carbon intensity of GDP
Compare the carbon intensity of GDP of any 2 countries
Sources:
- World Bank | Environment (1990–2024, updated October 2026)
Creative Commons Attribution (CC BY): you may copy, share, adapt and reuse this content, also commercially, as long as you credit statistics.wiki and note any changes you made. The sources listed above may have their own license terms.