
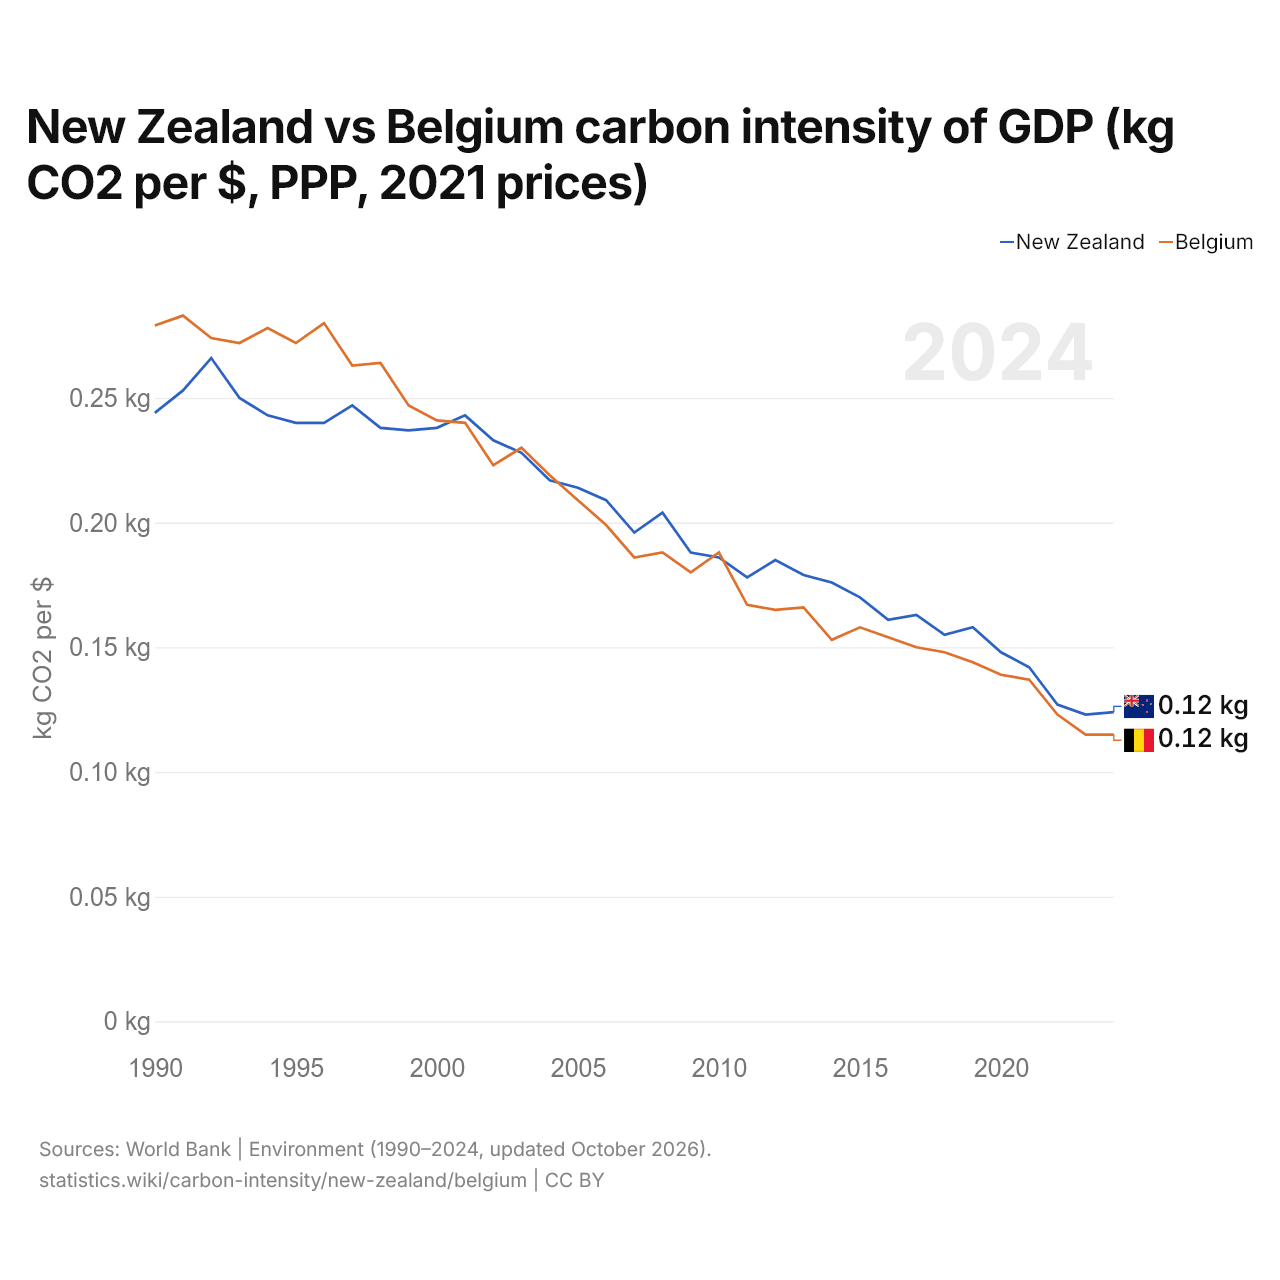
New Zealand vs Belgium carbon intensity of GDP (kg CO2 per $, PPP, 2021 prices)
1x
| Year | kg CO2 per $ | |
|---|---|---|
 New Zealand |
 Belgium |
|
| 2024 | 0.124 kg | 0.115 kg |
| 2023 | 0.123 kg | 0.115 kg |
| 2022 | 0.127 kg | 0.123 kg |
| 2021 | 0.142 kg | 0.137 kg |
| 2020 | 0.148 kg | 0.139 kg |
| 2019 | 0.158 kg | 0.144 kg |
| 2018 | 0.155 kg | 0.148 kg |
| 2017 | 0.163 kg | 0.15 kg |
| 2016 | 0.161 kg | 0.154 kg |
| 2015 | 0.17 kg | 0.158 kg |
| 2014 | 0.176 kg | 0.153 kg |
| 2013 | 0.179 kg | 0.166 kg |
| 2012 | 0.185 kg | 0.165 kg |
| 2011 | 0.178 kg | 0.167 kg |
| 2010 | 0.186 kg | 0.188 kg |
| 2009 | 0.188 kg | 0.18 kg |
| 2008 | 0.204 kg | 0.188 kg |
| 2007 | 0.196 kg | 0.186 kg |
| 2006 | 0.209 kg | 0.199 kg |
| 2005 | 0.214 kg | 0.209 kg |
| 2004 | 0.217 kg | 0.219 kg |
| 2003 | 0.228 kg | 0.23 kg |
| 2002 | 0.233 kg | 0.223 kg |
| 2001 | 0.243 kg | 0.24 kg |
| 2000 | 0.238 kg | 0.241 kg |
| 1999 | 0.237 kg | 0.247 kg |
| 1998 | 0.238 kg | 0.264 kg |
| 1997 | 0.247 kg | 0.263 kg |
| 1996 | 0.24 kg | 0.28 kg |
| 1995 | 0.24 kg | 0.272 kg |
| 1994 | 0.243 kg | 0.278 kg |
| 1993 | 0.25 kg | 0.272 kg |
| 1992 | 0.266 kg | 0.274 kg |
| 1991 | 0.253 kg | 0.283 kg |
| 1990 | 0.244 kg | 0.279 kg |
Carbon intensity is 0.124 kg of CO2 per dollar of GDP in New Zealand and 0.115 kg in Belgium: 0.009 kg more in New Zealand. In 1990, New Zealand emitted 0.244 kg and Belgium 0.279 kg, a difference of 0.035 kg.
New Zealand's carbon intensity has been higher than Belgium's every year since 2011. The gap was widest in 1996, when Belgium's carbon intensity was 0.040 kg above New Zealand's.
New Zealand vs Belgium: latest carbon intensity of GDP
|
New Zealand
|
Belgium
|
|
|---|---|---|
| kg CO2 per $ of GDP | 0.124 | 0.115 |
| World rank | 95/177 | 104/177 |
| Change since 1990 | −48.9% | −58.6% |
| Carbon intensity difference | 1.1× | 0.93× |
Compare the carbon intensity of GDP of any 2 countries
Sources:
- World Bank | Environment (1990–2024, updated October 2026)
Creative Commons Attribution (CC BY): you may copy, share, adapt and reuse this content, also commercially, as long as you credit statistics.wiki and note any changes you made. The sources listed above may have their own license terms.