
Taiwan vs Singapura: balança comercial por ano (US$), 1951–2025
| Ano | US$ | |
|---|---|---|
 Taiwan |
 Singapura |
|
| 2025 | US$ 175.730.816.366 | US$ 213.751.348.044 |
| 2024 | US$ 103.868.298.391 | US$ 206.306.460.026 |
| 2023 | US$ 99.599.518.967 | US$ 189.949.038.068 |
| 2022 | US$ 93.419.145.167 | US$ 204.540.835.459 |
| 2021 | US$ 110.101.001.084 | US$ 157.853.058.059 |
| 2020 | US$ 94.112.135.102 | US$ 109.861.553.827 |
| 2019 | US$ 61.602.988.387 | US$ 110.666.652.983 |
| 2018 | US$ 68.289.323.756 | US$ 112.259.997.835 |
| 2017 | US$ 78.822.748.418 | US$ 91.527.925.123 |
| 2016 | US$ 67.843.592.121 | US$ 84.211.383.479 |
| 2015 | US$ 68.868.916.045 | US$ 84.076.882.512 |
| 2014 | US$ 53.534.889.165 | US$ 73.803.243.755 |
| 2013 | US$ 44.597.419.023 | US$ 71.092.623.671 |
| 2012 | US$ 35.346.921.251 | US$ 71.489.970.200 |
| 2011 | US$ 31.508.135.989 | US$ 76.981.672.412 |
| 2010 | US$ 29.390.983.001 | US$ 63.099.153.067 |
| 2009 | US$ 33.299.169.241 | US$ 45.619.605.160 |
| 2008 | US$ 19.856.679.259 | US$ 40.002.940.218 |
| 2007 | US$ 30.133.874.910 | US$ 56.581.040.965 |
| 2006 | US$ 19.902.056.091 | US$ 45.646.166.327 |
| 2005 | US$ 13.759.784.756 | US$ 38.200.261.116 |
| 2004 | US$ 10.294.009.209 | US$ 30.345.491.851 |
| 2003 | US$ 19.713.655.175 | US$ 27.295.927.007 |
| 2002 | US$ 19.796.152.635 | US$ 17.051.326.157 |
| 2001 | US$ 14.254.666.034 | US$ 14.812.613.334 |
| 2000 | US$ 5.967.270.867 | US$ 11.853.212.627 |
| 1999 | US$ 6.729.466.177 | US$ 14.673.233.598 |
| 1998 | US$ 2.346.260.930 | US$ 18.428.037.251 |
| 1997 | US$ 5.331.353.679 | US$ 14.747.583.186 |
| 1996 | US$ 8.954.373.984 | US$ 15.768.052.135 |
| 1995 | US$ 3.860.320.666 | US$ 14.737.243.143 |
| 1994 | US$ 3.583.749.045 | US$ 11.915.592.323 |
| 1993 | US$ 3.233.303.779 | US$ 5.990.626.263 |
| 1992 | US$ 3.255.558.306 | US$ 6.328.550.548 |
| 1991 | US$ 6.934.344.190 | US$ 6.003.531.114 |
| 1990 | US$ 6.937.400.638 | US$ 3.633.543.557 |
| 1989 | US$ 9.408.935.239 | US$ 3.356.887.299 |
| 1988 | US$ 8.553.507.565 | US$ 2.425.783.476 |
| 1987 | US$ 16.386.726.889 | US$ 620.924.038 |
| 1986 | US$ 14.458.795.432 | US$ 489.841.371 |
| 1985 | US$ 8.214.902.611 | US$ 57.428.156 |
| 1984 | US$ 6.327.452.175 | US$ −38.570.752 |
| 1983 | US$ 4.465.957.867 | US$ 103.878.505 |
| 1982 | US$ 2.460.201.845 | US$ −294.693.993 |
| 1981 | US$ 958.960.559 | US$ −483.794.134 |
| 1980 | US$ −493.172.173 | US$ −823.737.699 |
| 1979 | US$ 375.529.010 | US$ −525.813.544 |
| 1978 | US$ 1.730.897.279 | US$ −280.027.876 |
| 1977 | US$ 1.063.558.823 | US$ −97.013.113 |
| 1976 | US$ 401.639.929 | US$ −438.999.705 |
| 1975 | US$ −508.044.189 | US$ −525.462.678 |
| 1974 | US$ −1.120.599.261 | US$ −784.365.590 |
| 1973 | US$ 568.986.665 | US$ −334.720.000 |
| 1972 | US$ 493.599.487 | US$ −423.869.931 |
| 1971 | US$ 162.197.589 | US$ −461.126.356 |
| 1970 | US$ −2.850.037 | US$ −365.017.869 |
| 1969 | US$ −35.598.581 | US$ −156.800.230 |
| 1968 | US$ −120.794.414 | US$ −78.138.781 |
| 1967 | US$ −74.631.036 | US$ −90.976.800 |
| 1966 | US$ 8.725.544 | US$ −79.184.116 |
| 1965 | US$ −84.323.530 | US$ −107.865.492 |
| 1964 | US$ 19.377.804 | US$ −97.118.142 |
| 1963 | US$ −24.971.622 | US$ −133.737.529 |
| 1962 | US$ −102.918.436 | US$ −85.946.126 |
| 1961 | US$ −124.121.510 | US$ −111.295.497 |
| 1960 | US$ −129.280.153 | US$ −96.236.141 |
| 1959 | US$ −117.696.324 | - |
| 1958 | US$ −115.652.908 | - |
| 1957 | US$ −82.951.885 | - |
| 1956 | US$ −95.184.616 | - |
| 1955 | US$ −83.290.787 | - |
| 1954 | US$ −135.500.533 | - |
| 1953 | US$ −76.248.741 | - |
| 1952 | US$ −102.221.766 | - |
| 1951 | US$ −56.223.169 | - |
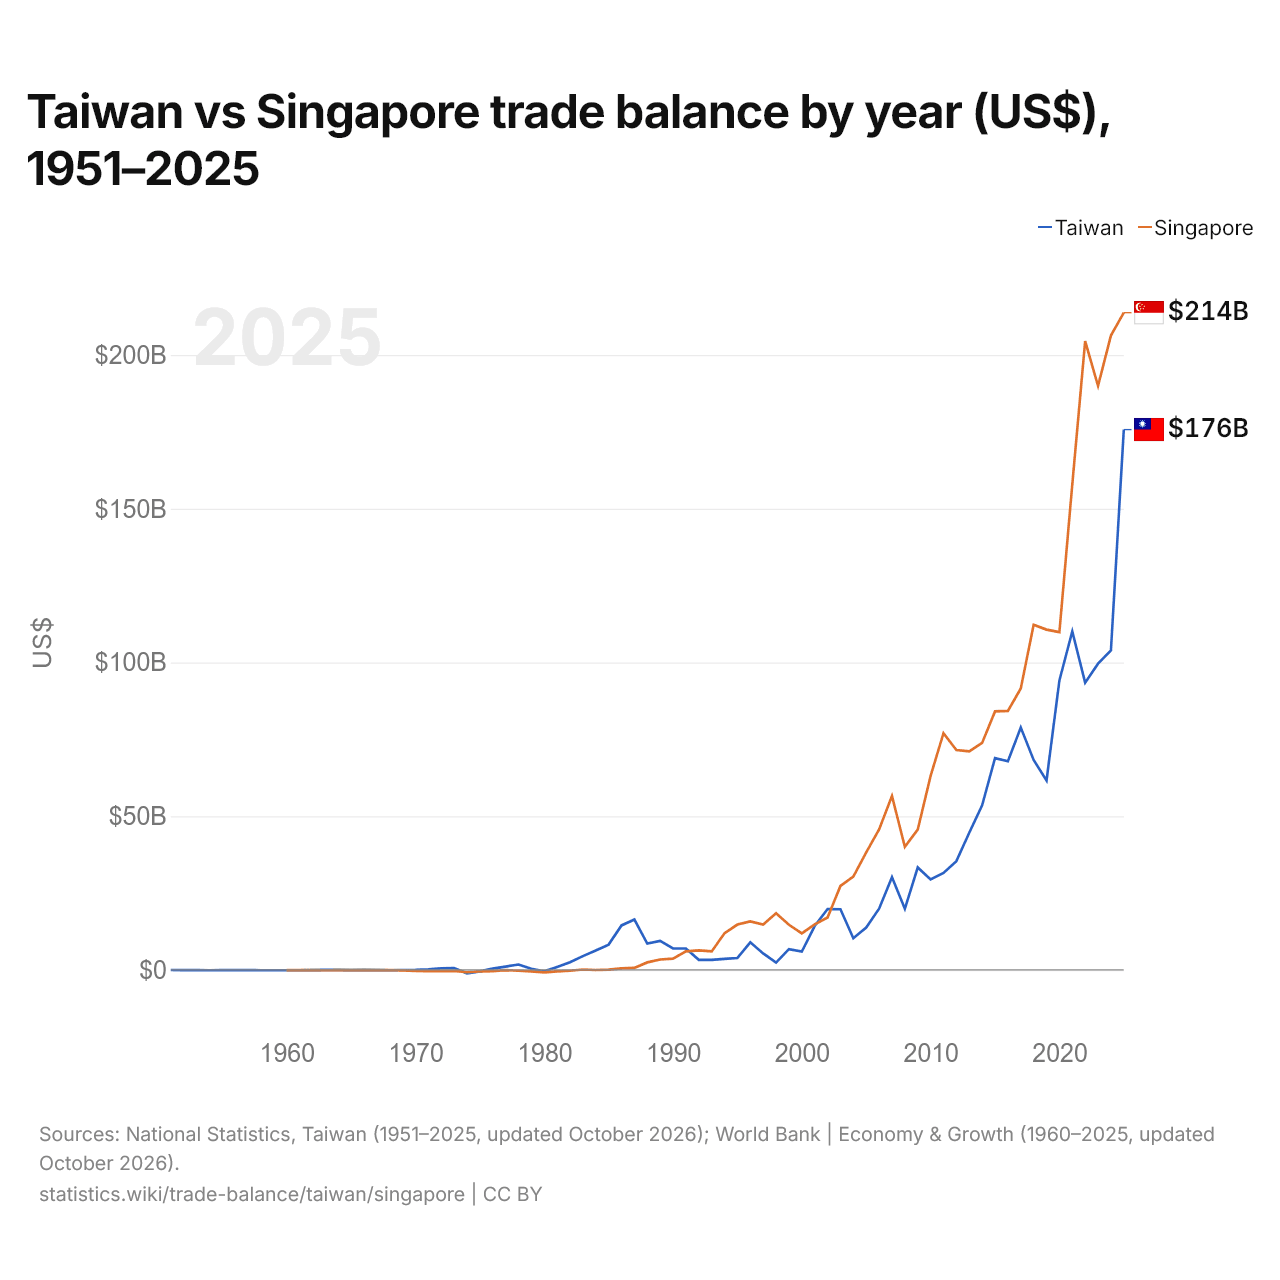
Em 2025, a balança comercial de Taiwan teve um superávit de US$ 176 bilhões e a de Singapura, um superávit de US$ 214 bilhões; o superávit de Singapura foi 22% maior. Em 1960, a balança comercial de Taiwan teve um déficit de US$ 129 milhões e a de Singapura, um déficit de US$ 96,2 milhões.
De 1960 a 2025, a balança comercial de Taiwan teve superávit em 54 dos 66 anos, e a de Singapura, em 42. As balanças comerciais de Taiwan e de Singapura tiveram déficit ao mesmo tempo em 12 desses anos, o mais recente em 1980.
Taiwan vs Singapura: dados da balança comercial
|
Taiwan
|
Singapura
|
|
|---|---|---|
| Bens e serviços, US$ | +US$ 176 bi (2025) | +US$ 214 bi (2025) |
| % do PIB | +19,1% (2025) | +35,4% (2025) |
| Anos com superávit desde 2000 | 26 de 26 | 26 de 26 |
| Saldo de bens entre os dois, dados próprios | n/d | n/d |
| Maior superávit em bens com | n/d | Indonésia (+US$ 19,5 bi, 2025) |
| Maior déficit em bens com | n/d | Emirados Árabes Unidos (-US$ 9,91 bi, 2025) |
Comparar a balança comercial de 2 países quaisquer
Fontes:
- National Statistics, Taiwan (1951–2025, atualizado em outubro de 2026)
- Banco Mundial | Economy & Growth (1960–2025, atualizado em outubro de 2026)
- TradeMap (2025, atualizado em outubro de 2026)
Creative Commons Atribuição (CC BY): você pode copiar, compartilhar, adaptar e reutilizar este conteúdo, inclusive para fins comerciais, desde que cite o statistics.wiki e indique as alterações que fizer. As fontes listadas acima podem ter suas próprias condições de licença.