
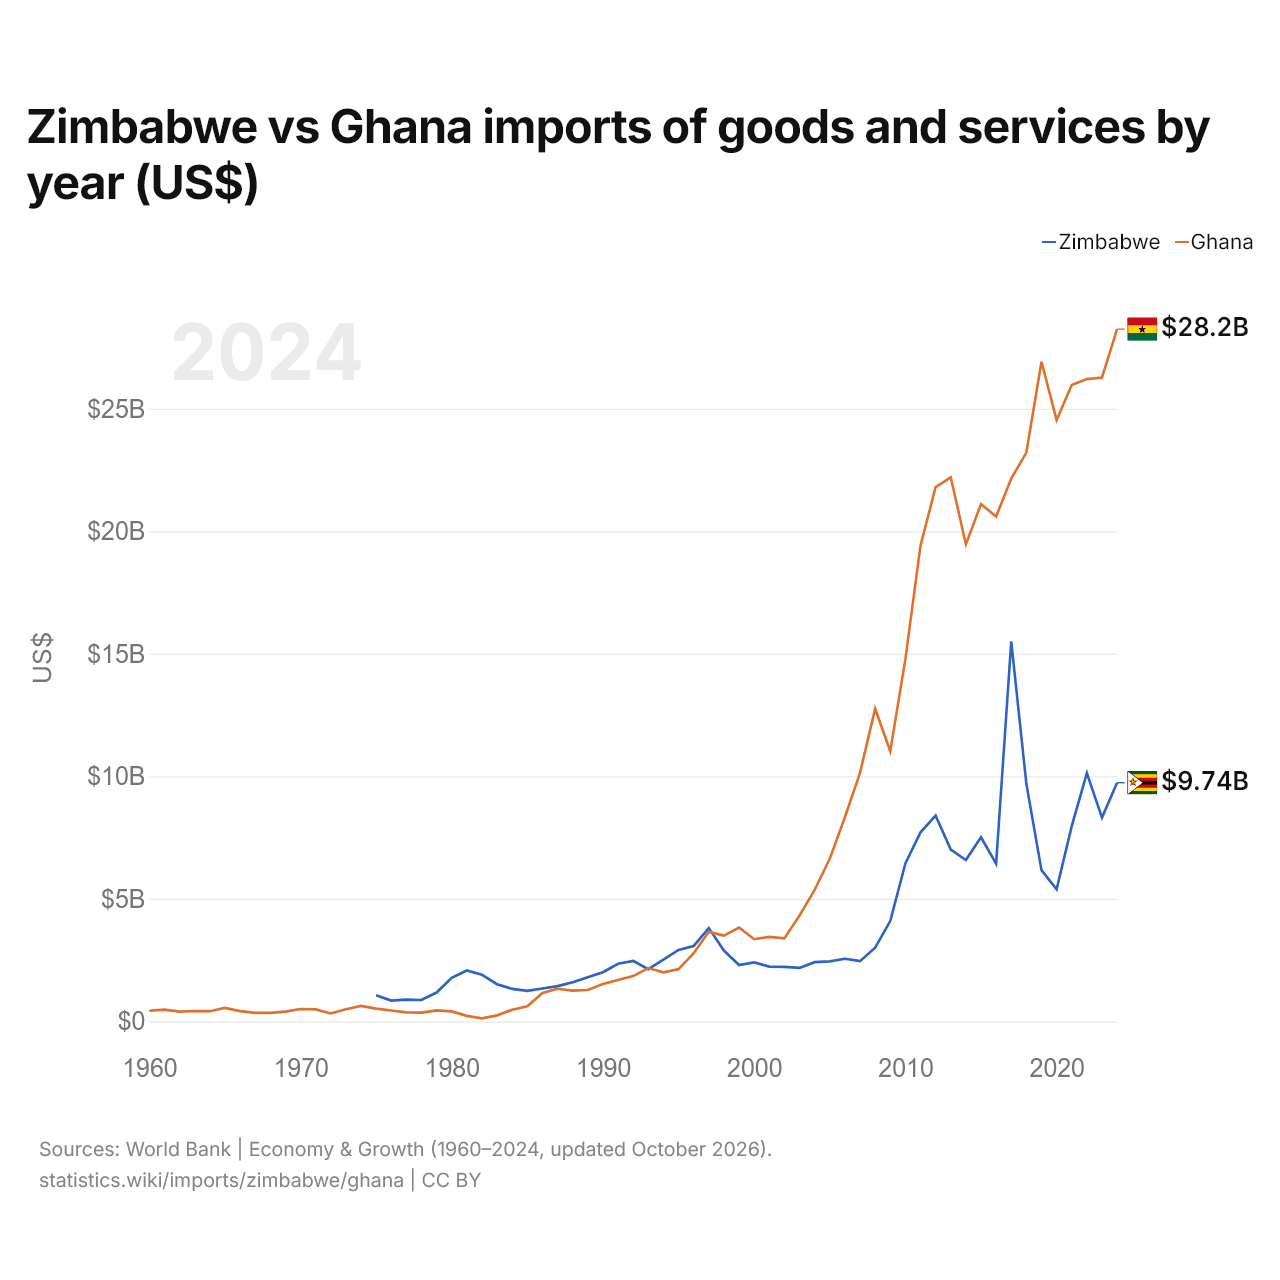
Zimbábue vs Gana: importações de bens e serviços por ano (US$)
1x
| Ano | US$ | |
|---|---|---|
 Zimbábue |
 Gana |
|
| 2024 | US$ 9.735.878.413 | US$ 28.244.066.026 |
| 2023 | US$ 8.312.993.034 | US$ 26.272.099.172 |
| 2022 | US$ 10.126.039.654 | US$ 26.205.330.554 |
| 2021 | US$ 7.964.377.625 | US$ 25.963.543.827 |
| 2020 | US$ 5.381.694.862 | US$ 24.537.944.240 |
| 2019 | US$ 6.166.366.675 | US$ 26.913.986.432 |
| 2018 | US$ 9.691.544.118 | US$ 23.206.913.262 |
| 2017 | US$ 15.499.601.594 | US$ 22.144.229.691 |
| 2016 | US$ 6.430.000.000 | US$ 20.595.796.191 |
| 2015 | US$ 7.507.750.000 | US$ 21.104.358.074 |
| 2014 | US$ 6.581.500.000 | US$ 19.468.106.209 |
| 2013 | US$ 7.004.000.000 | US$ 22.196.190.510 |
| 2012 | US$ 8.390.500.000 | US$ 21.795.097.067 |
| 2011 | US$ 7.712.750.000 | US$ 19.416.125.146 |
| 2010 | US$ 6.443.500.000 | US$ 14.779.077.374 |
| 2009 | US$ 4.090.750.000 | US$ 11.019.356.825 |
| 2008 | US$ 3.006.750.000 | US$ 12.757.957.188 |
| 2007 | US$ 2.456.000.000 | US$ 10.136.811.817 |
| 2006 | US$ 2.552.500.000 | US$ 8.325.374.082 |
| 2005 | US$ 2.447.000.000 | US$ 6.631.794.425 |
| 2004 | US$ 2.414.500.000 | US$ 5.361.446.367 |
| 2003 | US$ 2.180.750.000 | US$ 4.320.740.017 |
| 2002 | US$ 2.219.250.000 | US$ 3.383.577.207 |
| 2001 | US$ 2.233.500.000 | US$ 3.444.719.917 |
| 2000 | US$ 2.403.500.000 | US$ 3.350.776.354 |
| 1999 | US$ 2.299.500.000 | US$ 3.830.248.310 |
| 1998 | US$ 2.890.000.000 | US$ 3.496.235.606 |
| 1997 | US$ 3.807.000.000 | US$ 3.651.882.361 |
| 1996 | US$ 3.075.500.000 | US$ 2.779.627.875 |
| 1995 | US$ 2.911.500.000 | US$ 2.128.504.595 |
| 1994 | US$ 2.517.750.000 | US$ 2.002.227.733 |
| 1993 | US$ 2.131.000.000 | US$ 2.173.595.289 |
| 1992 | US$ 2.464.500.000 | US$ 1.845.761.703 |
| 1991 | US$ 2.349.000.000 | US$ 1.685.450.045 |
| 1990 | US$ 2.003.065.404 | US$ 1.522.350.993 |
| 1989 | US$ 1.800.729.748 | US$ 1.278.473.226 |
| 1988 | US$ 1.591.902.680 | US$ 1.250.692.247 |
| 1987 | US$ 1.434.918.067 | US$ 1.328.870.748 |
| 1986 | US$ 1.338.752.892 | US$ 1.154.912.517 |
| 1985 | US$ 1.241.275.948 | US$ 612.106.092 |
| 1984 | US$ 1.322.234.363 | US$ 475.228.311 |
| 1983 | US$ 1.512.740.982 | US$ 242.989.418 |
| 1982 | US$ 1.898.465.425 | US$ 120.354.809 |
| 1981 | US$ 2.076.439.449 | US$ 224.767.442 |
| 1980 | US$ 1.772.342.262 | US$ 406.950.207 |
| 1979 | US$ 1.173.870.049 | US$ 448.717.949 |
| 1978 | US$ 870.131.045 | US$ 354.799.302 |
| 1977 | US$ 882.823.923 | US$ 368.285.714 |
| 1976 | US$ 846.707.692 | US$ 443.644.068 |
| 1975 | US$ 1.068.612.734 | US$ 518.085.106 |
| 1974 | - | US$ 631.055.901 |
| 1973 | - | US$ 492.968.900 |
| 1972 | - | US$ 321.158.623 |
| 1971 | - | US$ 489.222.776 |
| 1970 | - | US$ 503.014.460 |
| 1969 | - | US$ 399.077.749 |
| 1968 | - | US$ 347.109.394 |
| 1967 | - | US$ 348.508.174 |
| 1966 | - | US$ 417.416.074 |
| 1965 | - | US$ 549.084.232 |
| 1964 | - | US$ 413.213.899 |
| 1963 | - | US$ 423.018.974 |
| 1962 | - | US$ 393.603.748 |
| 1961 | - | US$ 474.845.802 |
| 1960 | - | US$ 431.423.325 |
As importações de bens e serviços do Zimbábue são de US$ 9,74 bilhões (2024) e as de Gana, de US$ 28,2 bilhões (2024): as de Gana são 2,9 vezes maiores. Em 1975, as importações do Zimbábue foram 2,1 vezes maiores: US$ 1,07 bilhão do Zimbábue e US$ 518 milhões de Gana.
As importações de bens e serviços de Gana têm sido maiores que as do Zimbábue todos os anos desde 1998.
Zimbábue vs Gana: dados de importações
|
Zimbábue
|
Gana
|
|
|---|---|---|
| Importações | US$ 9,74 bi (2024) | US$ 28,2 bi (2024) |
| Posição mundial | 119/174 | 84/174 |
| Participação mundial | 0,03% | 0,09% |
| % do PIB | 23,4% | 33,9% |
| Maior categoria de bens | Petróleo, gás, minérios e outras matérias-primas (30,7%, 2025) | Petróleo, gás, minérios e outras matérias-primas (31,8%, 2025) |
| Principal origem dos bens | África do Sul (37,6%, 2025) | China (22,7%, 2025) |
Comparar as importações de 2 países quaisquer
Fontes:
- Banco Mundial | Economy & Growth (1960–2024, atualizado em outubro de 2026)
- TradeMap (2001–2025, atualizado em outubro de 2026)
Creative Commons Atribuição (CC BY): você pode copiar, compartilhar, adaptar e reutilizar este conteúdo, inclusive para fins comerciais, desde que cite o statistics.wiki e indique as alterações que fizer. As fontes listadas acima podem ter suas próprias condições de licença.