
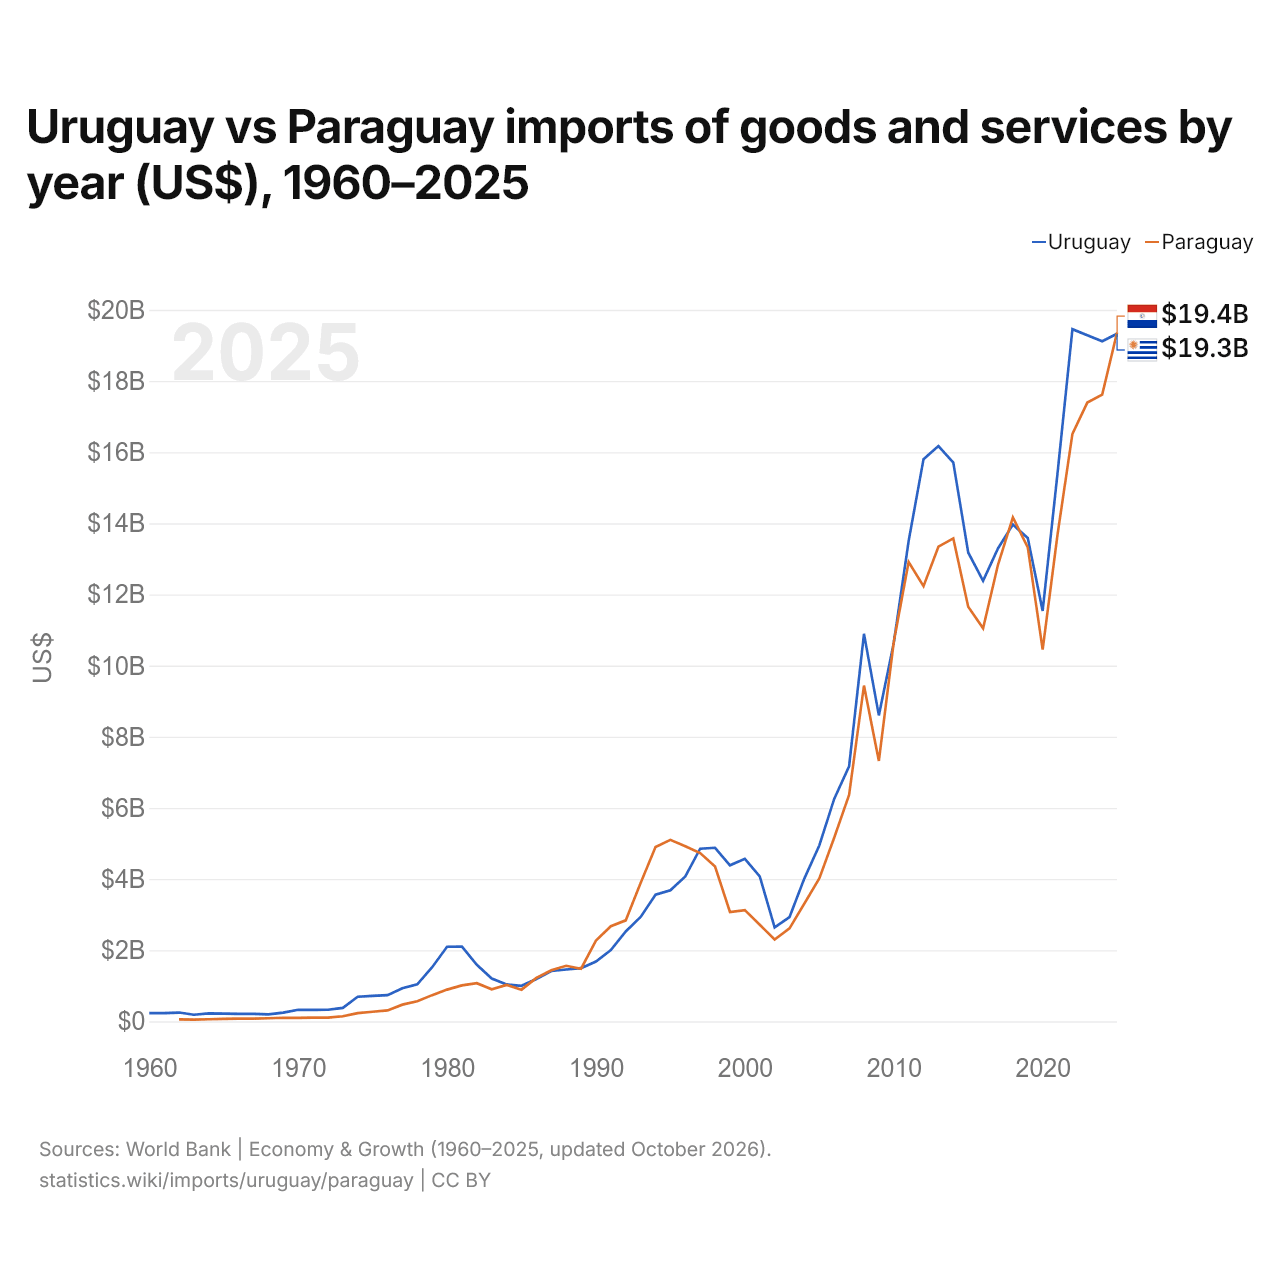
Uruguai vs Paraguai: importações de bens e serviços por ano (US$), 1960–2025
1x
| Ano | US$ | |
|---|---|---|
 Uruguai |
 Paraguai |
|
| 2025 | US$ 19.327.594.037 | US$ 19.366.371.817 |
| 2024 | US$ 19.118.102.906 | US$ 17.618.547.633 |
| 2023 | US$ 19.284.205.661 | US$ 17.394.262.697 |
| 2022 | US$ 19.456.784.754 | US$ 16.516.240.118 |
| 2021 | US$ 15.409.774.978 | US$ 13.685.252.890 |
| 2020 | US$ 11.538.603.069 | US$ 10.448.804.214 |
| 2019 | US$ 13.589.037.133 | US$ 13.325.018.619 |
| 2018 | US$ 13.963.973.875 | US$ 14.165.793.924 |
| 2017 | US$ 13.291.654.462 | US$ 12.834.286.732 |
| 2016 | US$ 12.380.703.255 | US$ 11.049.252.332 |
| 2015 | US$ 13.180.179.646 | US$ 11.652.991.233 |
| 2014 | US$ 15.709.177.870 | US$ 13.574.782.459 |
| 2013 | US$ 16.171.486.174 | US$ 13.343.028.125 |
| 2012 | US$ 15.804.109.317 | US$ 12.233.898.499 |
| 2011 | US$ 13.504.292.327 | US$ 12.912.863.193 |
| 2010 | US$ 10.636.951.485 | US$ 10.663.826.786 |
| 2009 | US$ 8.600.719.067 | US$ 7.320.133.400 |
| 2008 | US$ 10.893.438.975 | US$ 9.437.298.164 |
| 2007 | US$ 7.167.879.856 | US$ 6.361.555.843 |
| 2006 | US$ 6.252.911.447 | US$ 5.162.332.824 |
| 2005 | US$ 4.943.843.929 | US$ 4.018.871.465 |
| 2004 | US$ 4.018.907.625 | US$ 3.312.407.417 |
| 2003 | US$ 2.930.315.875 | US$ 2.613.734.808 |
| 2002 | US$ 2.640.670.228 | US$ 2.300.391.879 |
| 2001 | US$ 4.076.272.834 | US$ 2.715.523.960 |
| 2000 | US$ 4.568.223.557 | US$ 3.127.286.332 |
| 1999 | US$ 4.386.374.776 | US$ 3.071.972.020 |
| 1998 | US$ 4.879.194.086 | US$ 4.349.322.683 |
| 1997 | US$ 4.853.524.480 | US$ 4.729.946.872 |
| 1996 | US$ 4.074.053.358 | US$ 4.923.048.705 |
| 1995 | US$ 3.686.020.003 | US$ 5.100.987.429 |
| 1994 | US$ 3.561.674.786 | US$ 4.900.392.491 |
| 1993 | US$ 2.934.260.606 | US$ 3.891.800.193 |
| 1992 | US$ 2.527.397.075 | US$ 2.838.888.199 |
| 1991 | US$ 2.001.561.708 | US$ 2.674.820.829 |
| 1990 | US$ 1.682.744.698 | US$ 2.271.653.935 |
| 1989 | US$ 1.493.668.481 | US$ 1.478.470.884 |
| 1988 | US$ 1.456.747.009 | US$ 1.561.507.834 |
| 1987 | US$ 1.414.997.206 | US$ 1.433.992.382 |
| 1986 | US$ 1.191.819.539 | US$ 1.223.304.161 |
| 1985 | US$ 998.457.828 | US$ 890.425.802 |
| 1984 | US$ 1.036.760.496 | US$ 1.024.424.371 |
| 1983 | US$ 1.204.334.440 | US$ 901.287.917 |
| 1982 | US$ 1.587.083.734 | US$ 1.070.794.118 |
| 1981 | US$ 2.102.640.519 | US$ 1.011.111.111 |
| 1980 | US$ 2.096.775.971 | US$ 891.841.270 |
| 1979 | US$ 1.520.042.526 | US$ 736.523.810 |
| 1978 | US$ 1.038.743.774 | US$ 566.103.175 |
| 1977 | US$ 932.324.247 | US$ 469.507.937 |
| 1976 | US$ 736.320.969 | US$ 306.468.254 |
| 1975 | US$ 717.495.341 | US$ 269.849.206 |
| 1974 | US$ 690.867.044 | US$ 228.810.749 |
| 1973 | US$ 376.829.827 | US$ 142.063.492 |
| 1972 | US$ 326.095.659 | US$ 106.428.571 |
| 1971 | US$ 320.967.742 | US$ 105.952.381 |
| 1970 | US$ 325.000.000 | US$ 95.857.143 |
| 1969 | US$ 243.145.161 | US$ 101.253.968 |
| 1968 | US$ 194.518.825 | US$ 86.817.460 |
| 1967 | US$ 210.551.387 | US$ 76.992.063 |
| 1966 | US$ 207.824.339 | US$ 75.206.349 |
| 1965 | US$ 216.973.280 | US$ 69.873.016 |
| 1964 | US$ 224.109.460 | US$ 58.539.683 |
| 1963 | US$ 185.026.102 | US$ 49.809.524 |
| 1962 | US$ 246.804.760 | US$ 52.936.508 |
| 1961 | US$ 228.591.525 | - |
| 1960 | US$ 231.322.824 | - |
Em 2025, as importações de bens e serviços do Uruguai foram de US$ 19,3 bilhões e as do Paraguai, de US$ 19,4 bilhões: as do Paraguai foram 0,2% maiores. Em 1962, as importações do Uruguai foram 4,7 vezes maiores: US$ 247 milhões do Uruguai e US$ 52,9 milhões do Paraguai.
Uruguai vs Paraguai: dados de importações
|
Uruguai
|
Paraguai
|
|
|---|---|---|
| Importações | US$ 19,3 bi (2025) | US$ 19,4 bi (2025) |
| Posição mundial | 94/174 | 93/174 |
| Participação mundial | 0,06% | 0,06% |
| % do PIB | 22,6% | 39,3% |
| Maior categoria de bens | Máquinas, eletrônicos e veículos (33,8%, 2025) | Máquinas, eletrônicos e veículos (42,9%, 2025) |
| Principal origem dos bens | China (23,1%, 2025) | Brasil (22,9%, 2025) |
Comparar as importações de 2 países quaisquer
Fontes:
- Banco Mundial | Economy & Growth (1960–2025, atualizado em outubro de 2026)
- TradeMap (2001–2025, atualizado em outubro de 2026)
Creative Commons Atribuição (CC BY): você pode copiar, compartilhar, adaptar e reutilizar este conteúdo, inclusive para fins comerciais, desde que cite o statistics.wiki e indique as alterações que fizer. As fontes listadas acima podem ter suas próprias condições de licença.