
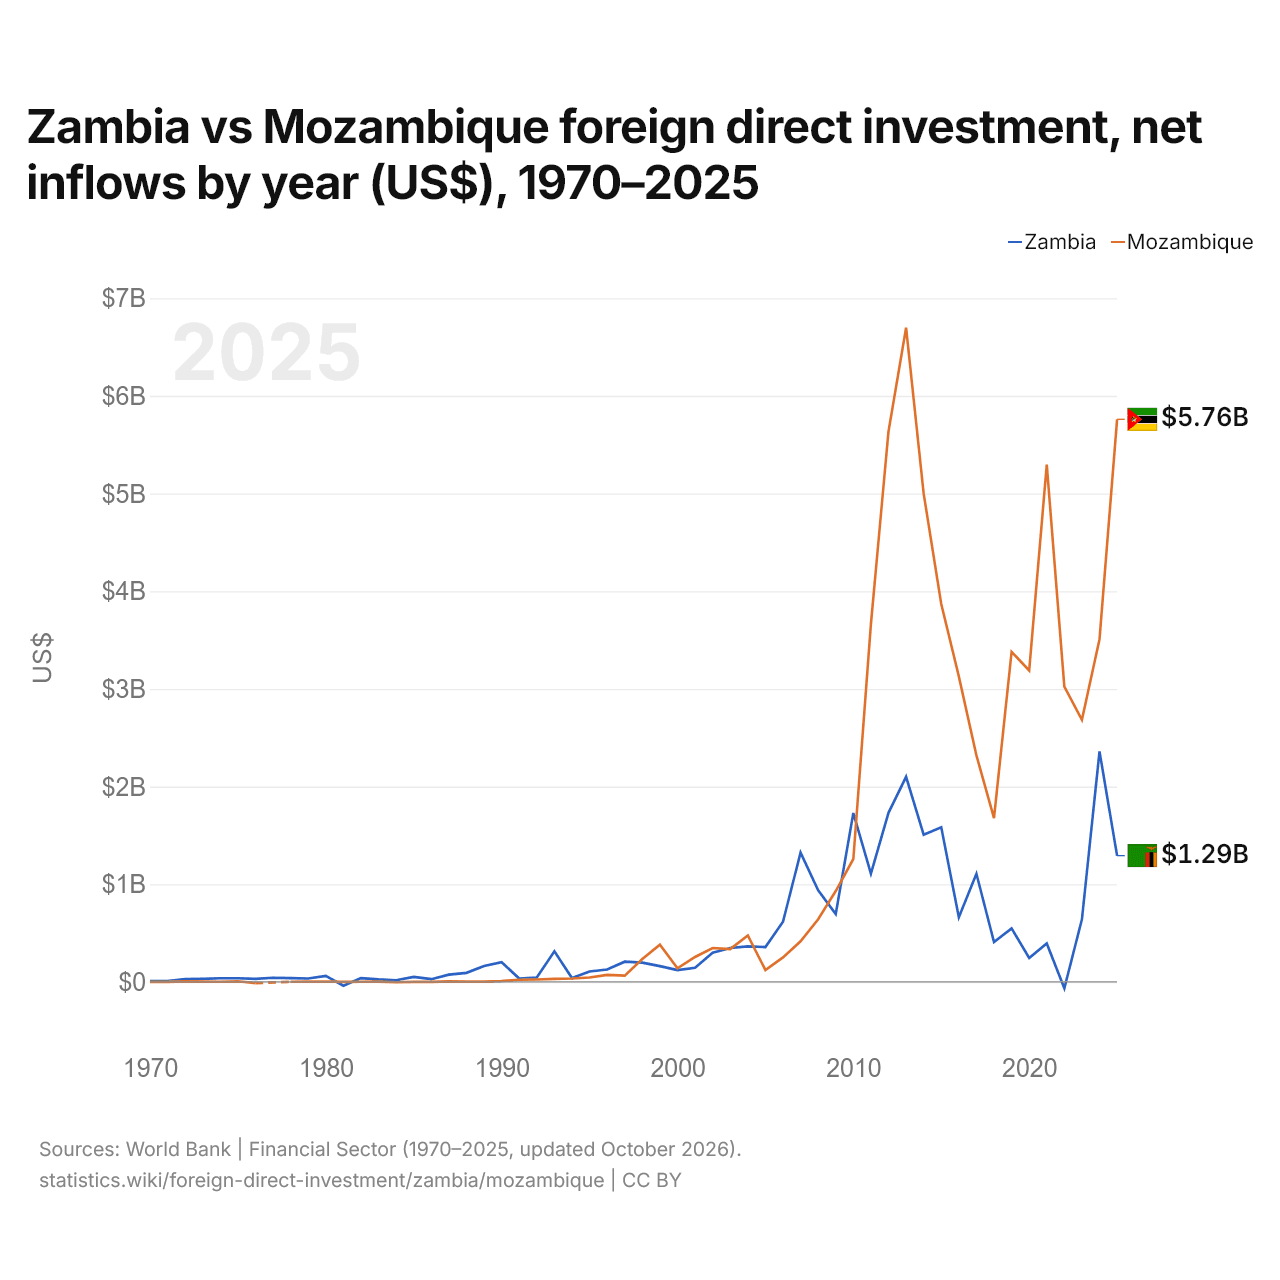
Zâmbia vs Moçambique: investimento estrangeiro direto, entradas líquidas por ano (US$), 1970–2025
| Ano | US$ | |
|---|---|---|
 Zâmbia |
 Moçambique |
|
| 2025 | US$ 1.292.675.899 | US$ 5.759.712.544 |
| 2024 | US$ 2.359.364.621 | US$ 3.508.626.212 |
| 2023 | US$ 641.091.891 | US$ 2.683.506.271 |
| 2022 | US$ −65.118.863 | US$ 3.022.175.565 |
| 2021 | US$ 394.217.415 | US$ 5.295.396.105 |
| 2020 | US$ 245.205.491 | US$ 3.187.942.207 |
| 2019 | US$ 547.967.910 | US$ 3.379.329.136 |
| 2018 | US$ 408.438.492 | US$ 1.678.061.192 |
| 2017 | US$ 1.107.519.805 | US$ 2.319.071.971 |
| 2016 | US$ 662.813.935 | US$ 3.128.149.929 |
| 2015 | US$ 1.582.666.667 | US$ 3.868.353.885 |
| 2014 | US$ 1.507.800.000 | US$ 4.998.799.334 |
| 2013 | US$ 2.099.800.000 | US$ 6.697.422.432 |
| 2012 | US$ 1.731.500.000 | US$ 5.635.092.659 |
| 2011 | US$ 1.108.500.000 | US$ 3.663.937.118 |
| 2010 | US$ 1.729.300.000 | US$ 1.258.453.097 |
| 2009 | US$ 694.800.000 | US$ 930.100.408 |
| 2008 | US$ 938.620.000 | US$ 641.399.416 |
| 2007 | US$ 1.323.900.000 | US$ 416.689.348 |
| 2006 | US$ 615.790.000 | US$ 251.141.650 |
| 2005 | US$ 356.940.000 | US$ 122.413.756 |
| 2004 | US$ 364.040.000 | US$ 475.513.573 |
| 2003 | US$ 347.000.000 | US$ 336.698.401 |
| 2002 | US$ 298.390.000 | US$ 347.252.831 |
| 2001 | US$ 145.000.000 | US$ 255.435.491 |
| 2000 | US$ 121.700.000 | US$ 139.300.000 |
| 1999 | US$ 162.000.000 | US$ 381.700.000 |
| 1998 | US$ 198.000.000 | US$ 234.900.000 |
| 1997 | US$ 207.400.000 | US$ 64.400.000 |
| 1996 | US$ 127.100.000 | US$ 72.500.000 |
| 1995 | US$ 107.000.000 | US$ 45.000.000 |
| 1994 | US$ 40.000.000 | US$ 35.000.000 |
| 1993 | US$ 314.400.000 | US$ 32.000.000 |
| 1992 | US$ 45.000.000 | US$ 25.300.000 |
| 1991 | US$ 34.300.000 | US$ 22.500.000 |
| 1990 | US$ 202.700.000 | US$ 9.200.000 |
| 1989 | US$ 163.700.000 | US$ 3.400.000 |
| 1988 | US$ 93.300.000 | US$ 4.500.000 |
| 1987 | US$ 74.500.000 | US$ 6.200.000 |
| 1986 | US$ 28.300.000 | US$ 1.500.000 |
| 1985 | US$ 51.500.000 | US$ 330.000 |
| 1984 | US$ 17.200.000 | US$ −2.920.000 |
| 1983 | US$ 25.700.000 | US$ 2.470.000 |
| 1982 | US$ 39.000.000 | US$ 1.930.000 |
| 1981 | US$ −38.400.000 | US$ 370.000 |
| 1980 | US$ 61.700.000 | US$ 4.360.000 |
| 1979 | US$ 35.200.000 | US$ 2.430.000 |
| 1978 | US$ 38.600.000 | US$ 2.000.000 |
| 1977 | US$ 42.960.000 | - |
| 1976 | US$ 31.000.000 | US$ −12.640.000 |
| 1975 | US$ 38.000.000 | US$ 6.670.000 |
| 1974 | US$ 38.000.000 | US$ 2.000.000 |
| 1973 | US$ 32.000.000 | US$ 4.020.000 |
| 1972 | US$ 29.000.000 | US$ 5.500.000 |
| 1971 | US$ 8.420.000 | US$ 30.000 |
| 1970 | US$ 9.520.000 | US$ 300.000 |
Em 2025, as entradas líquidas de investimento estrangeiro direto foram de US$ 1,29 bilhão na Zâmbia e de US$ 5,76 bilhões em Moçambique: 4,5 vezes mais em Moçambique. Em 1970, foram de US$ 9,52 milhões na Zâmbia e de US$ 300.000 em Moçambique.
As entradas líquidas de investimento estrangeiro direto na Zâmbia foram maiores que em Moçambique em 32 dos 55 anos de 1970 a 2025 que os dois países informaram, e menores em 23.
Zâmbia vs Moçambique: entradas e saídas mais recentes de investimento estrangeiro
|
Zâmbia
|
Moçambique
|
|
|---|---|---|
| Entradas líquidas | +US$ 1,29 bi | +US$ 5,76 bi |
| Entradas líquidas, % do PIB | +4,5% | +25,8% |
| Saídas líquidas | -US$ 256 mi | +US$ 66,7 mi |
| Entradas líquidas, total 2016–2025 | +US$ 7,59 bi | +US$ 34,0 bi |
| Posição mundial | 86/192 | 43/192 |
Comparar o investimento estrangeiro direto de 2 países quaisquer
Fontes:
- Banco Mundial | Financial Sector (1970–2025, atualizado em outubro de 2026)
Creative Commons Atribuição (CC BY): você pode copiar, compartilhar, adaptar e reutilizar este conteúdo, inclusive para fins comerciais, desde que cite o statistics.wiki e indique as alterações que fizer. As fontes listadas acima podem ter suas próprias condições de licença.