
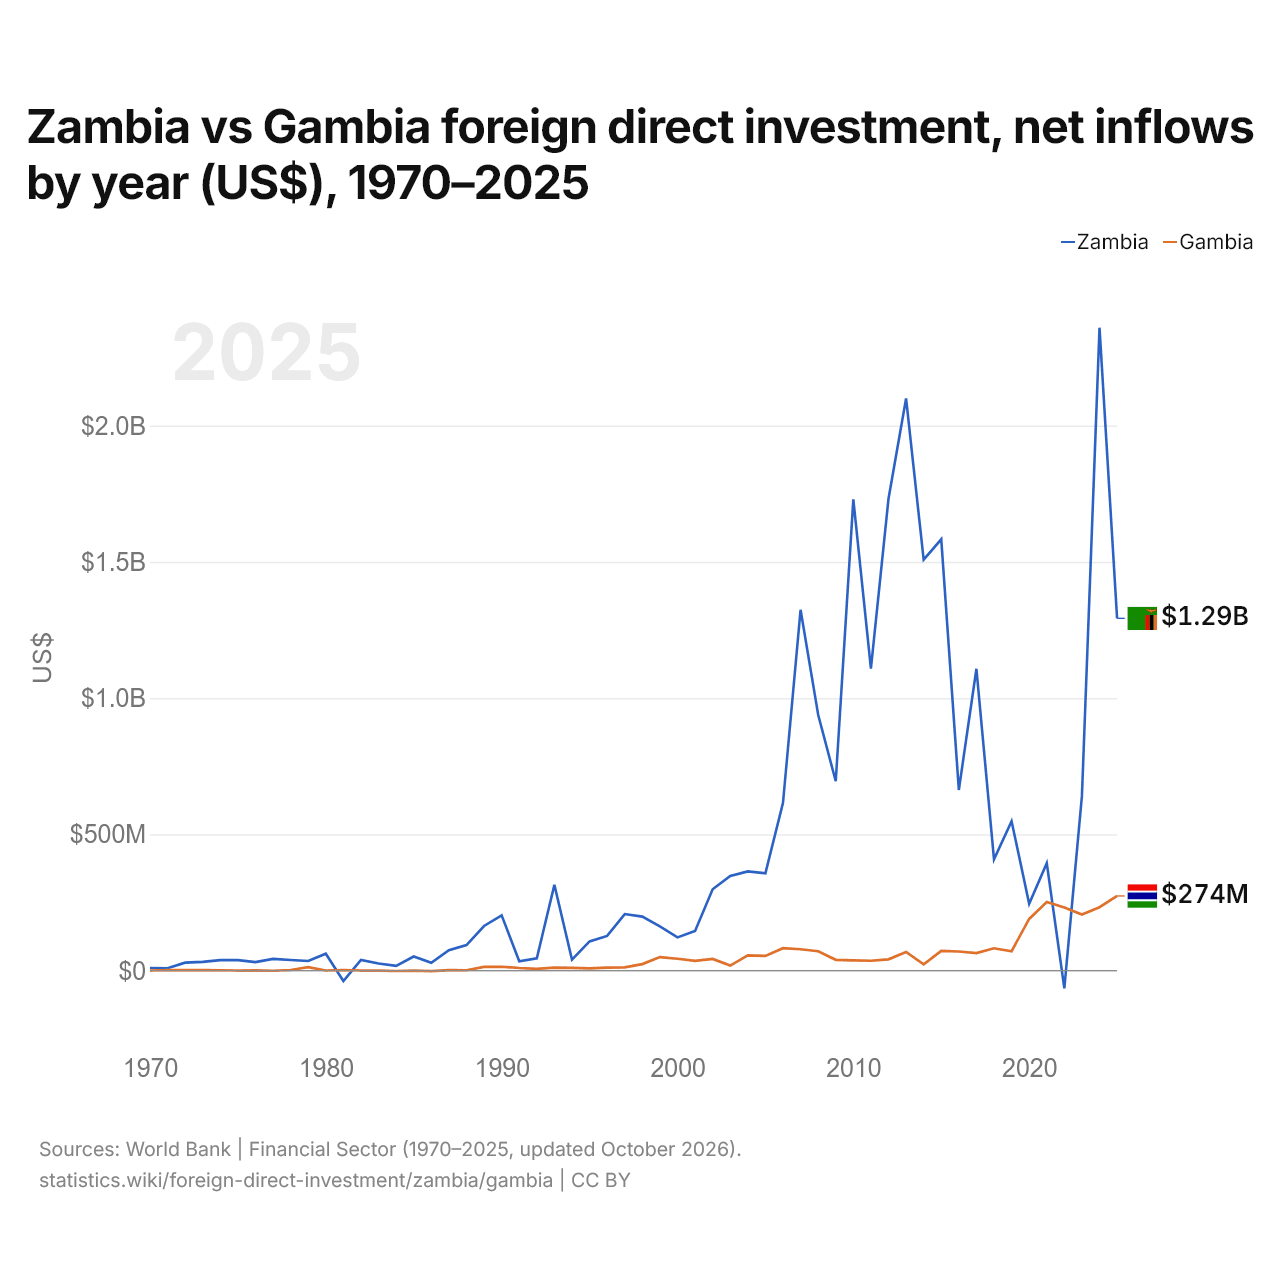
Zâmbia vs Gâmbia: investimento estrangeiro direto, entradas líquidas por ano (US$), 1970–2025
1x
| Ano | US$ | |
|---|---|---|
 Zâmbia |
 Gâmbia |
|
| 2025 | US$ 1.292.675.899 | US$ 273.723.967 |
| 2024 | US$ 2.359.364.621 | US$ 232.357.064 |
| 2023 | US$ 641.091.891 | US$ 205.541.474 |
| 2022 | US$ −65.118.863 | US$ 231.488.000 |
| 2021 | US$ 394.217.415 | US$ 251.822.629 |
| 2020 | US$ 245.205.491 | US$ 189.576.191 |
| 2019 | US$ 547.967.910 | US$ 71.083.306 |
| 2018 | US$ 408.438.492 | US$ 81.805.007 |
| 2017 | US$ 1.107.519.805 | US$ 64.338.516 |
| 2016 | US$ 662.813.935 | US$ 69.830.172 |
| 2015 | US$ 1.582.666.667 | US$ 71.976.052 |
| 2014 | US$ 1.507.800.000 | US$ 23.014.092 |
| 2013 | US$ 2.099.800.000 | US$ 68.340.322 |
| 2012 | US$ 1.731.500.000 | US$ 41.183.458 |
| 2011 | US$ 1.108.500.000 | US$ 36.077.136 |
| 2010 | US$ 1.729.300.000 | US$ 37.140.888 |
| 2009 | US$ 694.800.000 | US$ 39.447.344 |
| 2008 | US$ 938.620.000 | US$ 70.792.382 |
| 2007 | US$ 1.323.900.000 | US$ 78.094.821 |
| 2006 | US$ 615.790.000 | US$ 82.208.103 |
| 2005 | US$ 356.940.000 | US$ 53.650.280 |
| 2004 | US$ 364.040.000 | US$ 55.526.319 |
| 2003 | US$ 347.000.000 | US$ 18.272.720 |
| 2002 | US$ 298.390.000 | US$ 42.827.000 |
| 2001 | US$ 145.000.000 | US$ 35.480.000 |
| 2000 | US$ 121.700.000 | US$ 43.520.000 |
| 1999 | US$ 162.000.000 | US$ 49.480.000 |
| 1998 | US$ 198.000.000 | US$ 23.700.000 |
| 1997 | US$ 207.400.000 | US$ 11.666.476 |
| 1996 | US$ 127.100.000 | US$ 10.655.114 |
| 1995 | US$ 107.000.000 | US$ 7.729.249 |
| 1994 | US$ 40.000.000 | US$ 9.716.367 |
| 1993 | US$ 314.400.000 | US$ 10.741.222 |
| 1992 | US$ 45.000.000 | US$ 6.323.269 |
| 1991 | US$ 34.300.000 | US$ 9.270.433 |
| 1990 | US$ 202.700.000 | US$ 14.120.000 |
| 1989 | US$ 163.700.000 | US$ 13.713.834 |
| 1988 | US$ 93.300.000 | US$ 1.177.624 |
| 1987 | US$ 74.500.000 | US$ 1.525.218 |
| 1986 | US$ 28.300.000 | US$ −1.990.000 |
| 1985 | US$ 51.500.000 | US$ −500.000 |
| 1984 | US$ 17.200.000 | US$ −1.700.000 |
| 1983 | US$ 25.700.000 | US$ −400.000 |
| 1982 | US$ 39.000.000 | US$ 270.000 |
| 1981 | US$ −38.400.000 | US$ 2.009.878 |
| 1980 | US$ 61.700.000 | US$ 280.000 |
| 1979 | US$ 35.200.000 | US$ 12.364.862 |
| 1978 | US$ 38.600.000 | US$ 2.104.763 |
| 1977 | US$ 42.960.000 | US$ −560.000 |
| 1976 | US$ 31.000.000 | US$ 900.000 |
| 1975 | US$ 38.000.000 | US$ 100.000 |
| 1974 | US$ 38.000.000 | US$ 1.200.000 |
| 1973 | US$ 32.000.000 | US$ 1.400.000 |
| 1972 | US$ 29.000.000 | US$ 1.700.000 |
| 1971 | US$ 8.420.000 | US$ 1.700.000 |
| 1970 | US$ 9.520.000 | US$ 100.000 |
Em 2025, as entradas líquidas de investimento estrangeiro direto foram de US$ 1,29 bilhão na Zâmbia e de US$ 274 milhões na Gâmbia: 4,7 vezes mais na Zâmbia. Em 1970, foram de US$ 9,52 milhões na Zâmbia e de US$ 100.000 na Gâmbia.
As entradas líquidas de investimento estrangeiro direto na Zâmbia foram maiores que na Gâmbia em 54 dos 56 anos de 1970 a 2025, e menores em 2.
Zâmbia vs Gâmbia: entradas e saídas mais recentes de investimento estrangeiro
|
Zâmbia
|
Gâmbia
|
|
|---|---|---|
| Entradas líquidas | +US$ 1,29 bi | +US$ 274 mi |
| Entradas líquidas, % do PIB | +4,5% | +10,6% |
| Saídas líquidas | -US$ 256 mi | -US$ 871 mil |
| Entradas líquidas, total 2016–2025 | +US$ 7,59 bi | +US$ 1,67 bi |
| Posição mundial | 86/192 | 129/192 |
Comparar o investimento estrangeiro direto de 2 países quaisquer
Fontes:
- Banco Mundial | Financial Sector (1970–2025, atualizado em outubro de 2026)
Creative Commons Atribuição (CC BY): você pode copiar, compartilhar, adaptar e reutilizar este conteúdo, inclusive para fins comerciais, desde que cite o statistics.wiki e indique as alterações que fizer. As fontes listadas acima podem ter suas próprias condições de licença.