
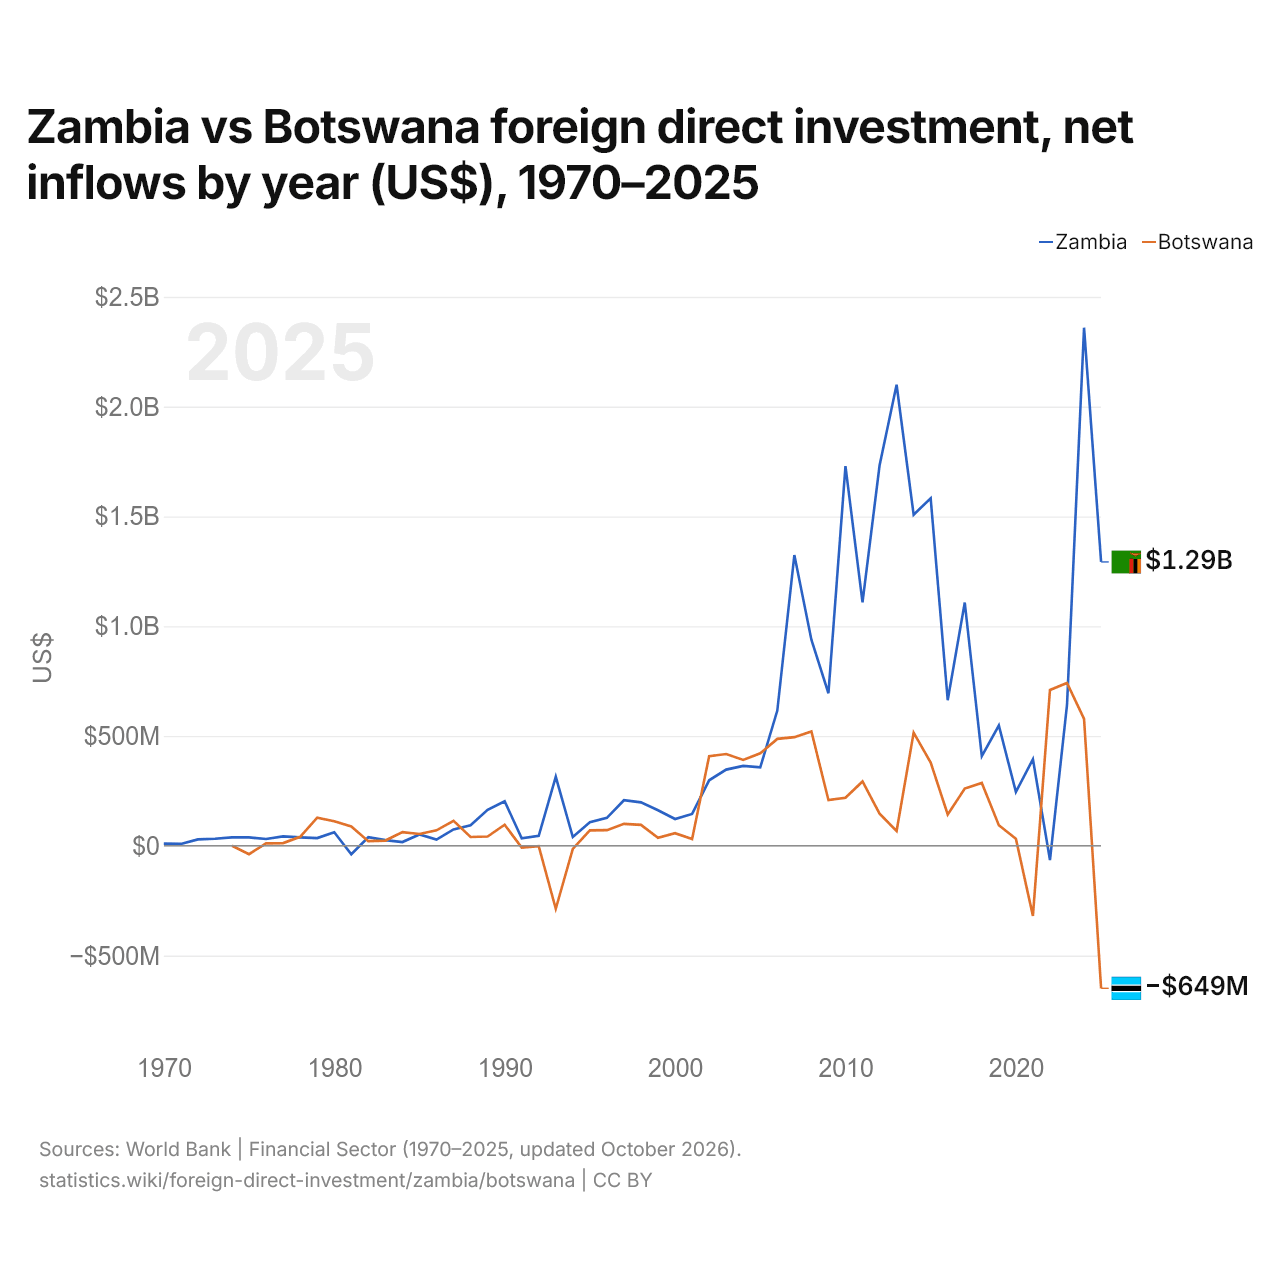
Zâmbia vs Botsuana: investimento estrangeiro direto, entradas líquidas por ano (US$), 1970–2025
1x
| Ano | US$ | |
|---|---|---|
 Zâmbia |
 Botsuana |
|
| 2025 | US$ 1.292.675.899 | US$ −648.995.319 |
| 2024 | US$ 2.359.364.621 | US$ 577.945.337 |
| 2023 | US$ 641.091.891 | US$ 741.532.368 |
| 2022 | US$ −65.118.863 | US$ 709.624.140 |
| 2021 | US$ 394.217.415 | US$ −319.055.858 |
| 2020 | US$ 245.205.491 | US$ 31.792.610 |
| 2019 | US$ 547.967.910 | US$ 93.607.130 |
| 2018 | US$ 408.438.492 | US$ 285.955.062 |
| 2017 | US$ 1.107.519.805 | US$ 260.575.129 |
| 2016 | US$ 662.813.935 | US$ 142.522.598 |
| 2015 | US$ 1.582.666.667 | US$ 378.554.182 |
| 2014 | US$ 1.507.800.000 | US$ 515.184.471 |
| 2013 | US$ 2.099.800.000 | US$ 67.136.806 |
| 2012 | US$ 1.731.500.000 | US$ 146.084.155 |
| 2011 | US$ 1.108.500.000 | US$ 293.208.060 |
| 2010 | US$ 1.729.300.000 | US$ 218.379.838 |
| 2009 | US$ 694.800.000 | US$ 208.699.298 |
| 2008 | US$ 938.620.000 | US$ 520.917.902 |
| 2007 | US$ 1.323.900.000 | US$ 494.634.226 |
| 2006 | US$ 615.790.000 | US$ 486.913.109 |
| 2005 | US$ 356.940.000 | US$ 420.854.175 |
| 2004 | US$ 364.040.000 | US$ 390.889.252 |
| 2003 | US$ 347.000.000 | US$ 418.040.676 |
| 2002 | US$ 298.390.000 | US$ 407.997.392 |
| 2001 | US$ 145.000.000 | US$ 30.680.571 |
| 2000 | US$ 121.700.000 | US$ 57.171.341 |
| 1999 | US$ 162.000.000 | US$ 36.675.066 |
| 1998 | US$ 198.000.000 | US$ 95.318.135 |
| 1997 | US$ 207.400.000 | US$ 100.109.749 |
| 1996 | US$ 127.100.000 | US$ 71.182.311 |
| 1995 | US$ 107.000.000 | US$ 70.413.221 |
| 1994 | US$ 40.000.000 | US$ −14.154.569 |
| 1993 | US$ 314.400.000 | US$ −286.949.434 |
| 1992 | US$ 45.000.000 | US$ −1.564.185 |
| 1991 | US$ 34.300.000 | US$ −8.211.494 |
| 1990 | US$ 202.700.000 | US$ 95.889.963 |
| 1989 | US$ 163.700.000 | US$ 42.186.013 |
| 1988 | US$ 93.300.000 | US$ 39.921.524 |
| 1987 | US$ 74.500.000 | US$ 113.583.514 |
| 1986 | US$ 28.300.000 | US$ 70.404.391 |
| 1985 | US$ 51.500.000 | US$ 53.611.788 |
| 1984 | US$ 17.200.000 | US$ 62.154.696 |
| 1983 | US$ 25.700.000 | US$ 23.793.769 |
| 1982 | US$ 39.000.000 | US$ 21.074.901 |
| 1981 | US$ −38.400.000 | US$ 88.438.640 |
| 1980 | US$ 61.700.000 | US$ 111.550.709 |
| 1979 | US$ 35.200.000 | US$ 127.851.715 |
| 1978 | US$ 38.600.000 | US$ 40.813.517 |
| 1977 | US$ 42.960.000 | US$ 12.233.365 |
| 1976 | US$ 31.000.000 | US$ 11.270.003 |
| 1975 | US$ 38.000.000 | US$ −38.268.702 |
| 1974 | US$ 38.000.000 | US$ 70.000 |
| 1973 | US$ 32.000.000 | - |
| 1972 | US$ 29.000.000 | - |
| 1971 | US$ 8.420.000 | - |
| 1970 | US$ 9.520.000 | - |
Em 2025, as entradas líquidas de investimento estrangeiro direto foram de US$ 1,29 bilhão na Zâmbia e negativas em Botsuana, de US$ 649 milhões. Em 1974, foram de US$ 38 milhões na Zâmbia e de US$ 70.000 em Botsuana.
As entradas líquidas de investimento estrangeiro direto na Zâmbia foram maiores que em Botsuana em 38 dos 52 anos de 1974 a 2025, e menores em 14.
Zâmbia vs Botsuana: entradas e saídas mais recentes de investimento estrangeiro
|
Zâmbia
|
Botsuana
|
|
|---|---|---|
| Entradas líquidas | +US$ 1,29 bi | -US$ 649 mi |
| Entradas líquidas, % do PIB | +4,5% | −3,3% |
| Saídas líquidas | -US$ 256 mi | +US$ 124 mi |
| Entradas líquidas, total 2016–2025 | +US$ 7,59 bi | +US$ 1,88 bi |
| Posição mundial | 86/192 | 180/192 |
Comparar o investimento estrangeiro direto de 2 países quaisquer
Fontes:
- Banco Mundial | Financial Sector (1970–2025, atualizado em outubro de 2026)
Creative Commons Atribuição (CC BY): você pode copiar, compartilhar, adaptar e reutilizar este conteúdo, inclusive para fins comerciais, desde que cite o statistics.wiki e indique as alterações que fizer. As fontes listadas acima podem ter suas próprias condições de licença.