
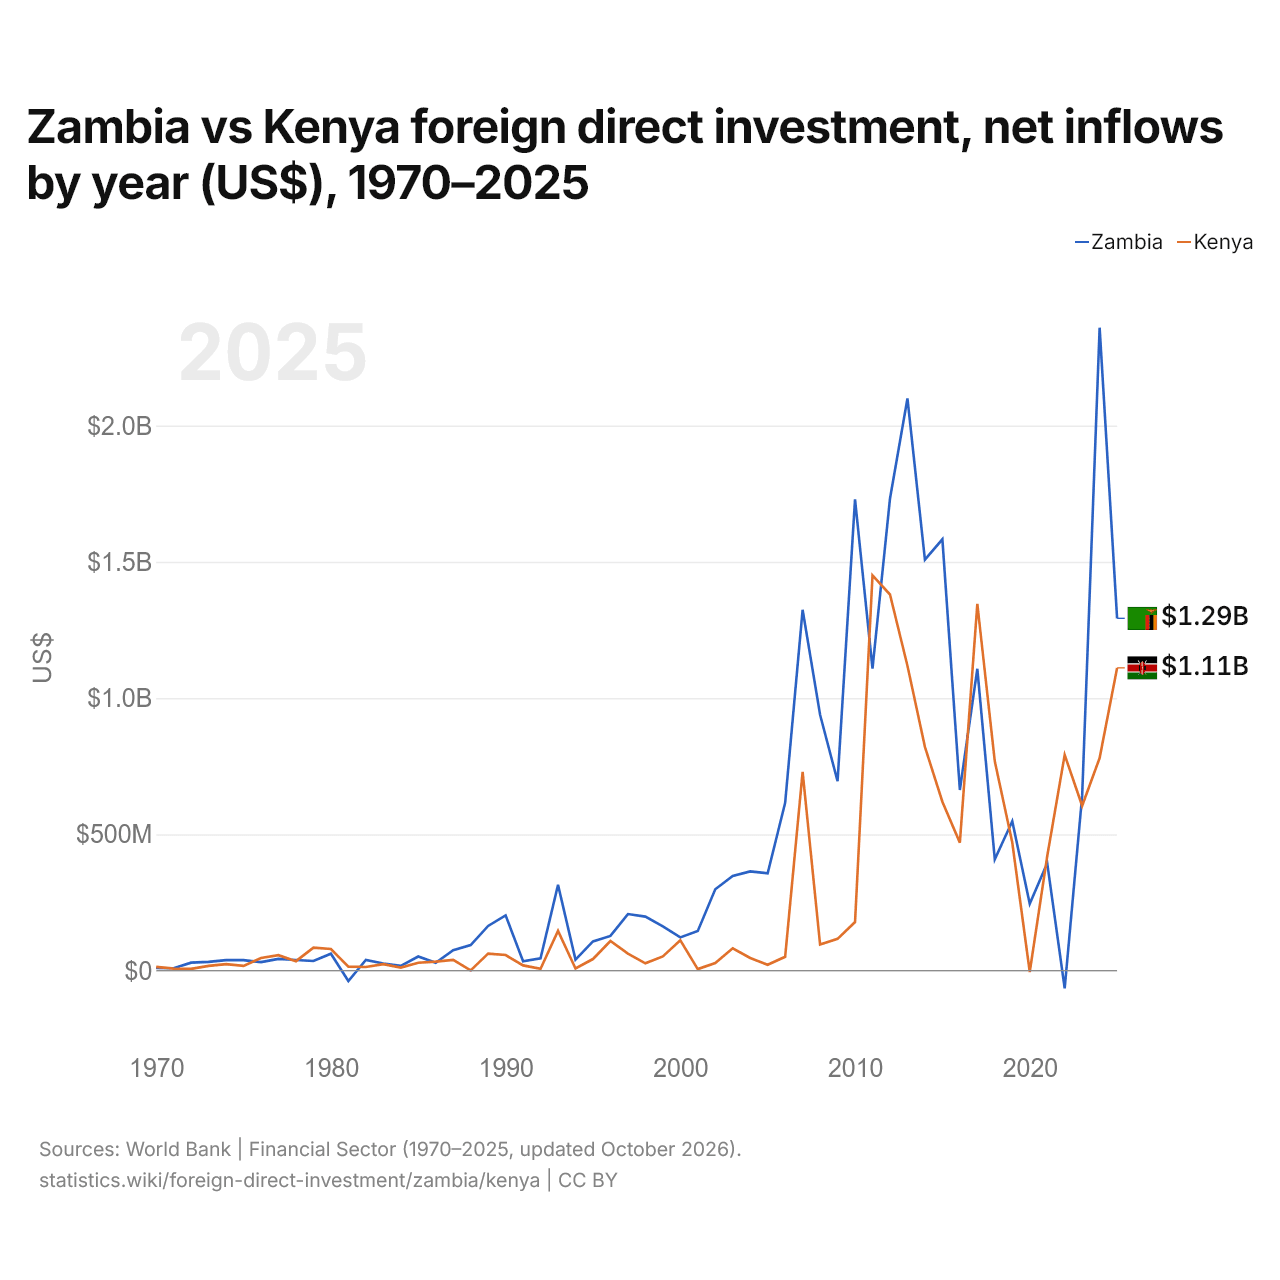
Zâmbia vs Quênia: investimento estrangeiro direto, entradas líquidas por ano (US$), 1970–2025
1x
| Ano | US$ | |
|---|---|---|
 Zâmbia |
 Quênia |
|
| 2025 | US$ 1.292.675.899 | US$ 1.110.789.689 |
| 2024 | US$ 2.359.364.621 | US$ 780.100.474 |
| 2023 | US$ 641.091.891 | US$ 604.719.207 |
| 2022 | US$ −65.118.863 | US$ 791.581.760 |
| 2021 | US$ 394.217.415 | US$ 419.719.613 |
| 2020 | US$ 245.205.491 | US$ −5.403.752 |
| 2019 | US$ 547.967.910 | US$ 469.940.267 |
| 2018 | US$ 408.438.492 | US$ 767.761.507 |
| 2017 | US$ 1.107.519.805 | US$ 1.346.085.345 |
| 2016 | US$ 662.813.935 | US$ 469.533.311 |
| 2015 | US$ 1.582.666.667 | US$ 619.724.465 |
| 2014 | US$ 1.507.800.000 | US$ 820.937.598 |
| 2013 | US$ 2.099.800.000 | US$ 1.118.825.000 |
| 2012 | US$ 1.731.500.000 | US$ 1.380.173.662 |
| 2011 | US$ 1.108.500.000 | US$ 1.450.474.757 |
| 2010 | US$ 1.729.300.000 | US$ 178.064.607 |
| 2009 | US$ 694.800.000 | US$ 116.257.609 |
| 2008 | US$ 938.620.000 | US$ 95.585.680 |
| 2007 | US$ 1.323.900.000 | US$ 729.044.146 |
| 2006 | US$ 615.790.000 | US$ 50.674.725 |
| 2005 | US$ 356.940.000 | US$ 21.211.685 |
| 2004 | US$ 364.040.000 | US$ 46.063.931 |
| 2003 | US$ 347.000.000 | US$ 81.738.243 |
| 2002 | US$ 298.390.000 | US$ 27.618.447 |
| 2001 | US$ 145.000.000 | US$ 5.302.623 |
| 2000 | US$ 121.700.000 | US$ 110.904.550 |
| 1999 | US$ 162.000.000 | US$ 51.953.456 |
| 1998 | US$ 198.000.000 | US$ 26.548.246 |
| 1997 | US$ 207.400.000 | US$ 62.096.810 |
| 1996 | US$ 127.100.000 | US$ 108.672.932 |
| 1995 | US$ 107.000.000 | US$ 42.289.248 |
| 1994 | US$ 40.000.000 | US$ 7.432.413 |
| 1993 | US$ 314.400.000 | US$ 145.655.517 |
| 1992 | US$ 45.000.000 | US$ 6.363.133 |
| 1991 | US$ 34.300.000 | US$ 18.830.977 |
| 1990 | US$ 202.700.000 | US$ 57.081.096 |
| 1989 | US$ 163.700.000 | US$ 62.189.917 |
| 1988 | US$ 93.300.000 | US$ 394.431 |
| 1987 | US$ 74.500.000 | US$ 39.381.344 |
| 1986 | US$ 28.300.000 | US$ 32.725.777 |
| 1985 | US$ 51.500.000 | US$ 28.845.949 |
| 1984 | US$ 17.200.000 | US$ 10.753.527 |
| 1983 | US$ 25.700.000 | US$ 23.738.843 |
| 1982 | US$ 39.000.000 | US$ 13.000.895 |
| 1981 | US$ −38.400.000 | US$ 14.147.557 |
| 1980 | US$ 61.700.000 | US$ 78.973.746 |
| 1979 | US$ 35.200.000 | US$ 84.009.903 |
| 1978 | US$ 38.600.000 | US$ 34.414.130 |
| 1977 | US$ 42.960.000 | US$ 56.545.226 |
| 1976 | US$ 31.000.000 | US$ 46.371.851 |
| 1975 | US$ 38.000.000 | US$ 17.158.747 |
| 1974 | US$ 38.000.000 | US$ 23.420.000 |
| 1973 | US$ 32.000.000 | US$ 17.260.000 |
| 1972 | US$ 29.000.000 | US$ 6.300.000 |
| 1971 | US$ 8.420.000 | US$ 7.400.000 |
| 1970 | US$ 9.520.000 | US$ 13.800.000 |
Em 2025, as entradas líquidas de investimento estrangeiro direto foram de US$ 1,29 bilhão na Zâmbia e de US$ 1,11 bilhão no Quênia: 16% a mais na Zâmbia. Em 1970, foram de US$ 9,52 milhões na Zâmbia e de US$ 13,8 milhões no Quênia.
As entradas líquidas de investimento estrangeiro direto na Zâmbia foram maiores que no Quênia em 44 dos 56 anos de 1970 a 2025, e menores em 12.
Zâmbia vs Quênia: entradas e saídas mais recentes de investimento estrangeiro
|
Zâmbia
|
Quênia
|
|
|---|---|---|
| Entradas líquidas | +US$ 1,29 bi | +US$ 1,11 bi |
| Entradas líquidas, % do PIB | +4,5% | +0,8% |
| Saídas líquidas | -US$ 256 mi | +US$ 430 mi |
| Entradas líquidas, total 2016–2025 | +US$ 7,59 bi | +US$ 6,75 bi |
| Posição mundial | 86/192 | 89/192 |
Comparar o investimento estrangeiro direto de 2 países quaisquer
Fontes:
- Banco Mundial | Financial Sector (1970–2025, atualizado em outubro de 2026)
Creative Commons Atribuição (CC BY): você pode copiar, compartilhar, adaptar e reutilizar este conteúdo, inclusive para fins comerciais, desde que cite o statistics.wiki e indique as alterações que fizer. As fontes listadas acima podem ter suas próprias condições de licença.