
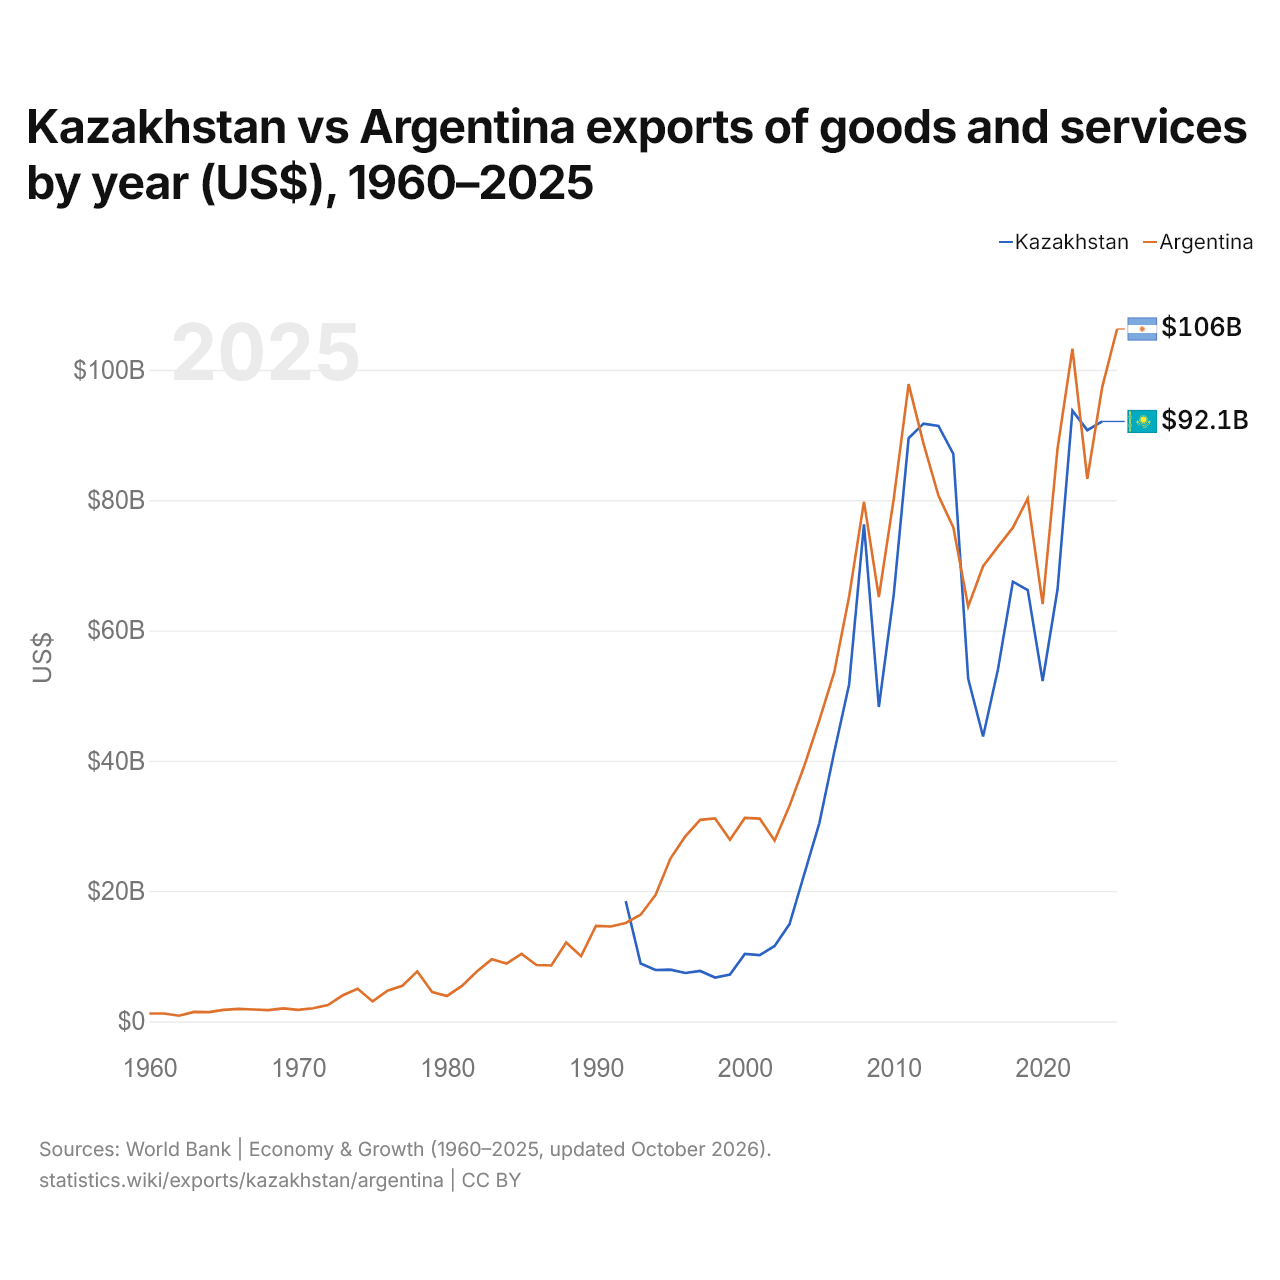
Cazaquistão vs Argentina: exportações de bens e serviços por ano (US$), 1960–2025
| Ano | US$ | |
|---|---|---|
 Cazaquistão |
 Argentina |
|
| 2025 | - | US$ 106.260.393.151 |
| 2024 | US$ 92.070.351.467 | US$ 97.349.127.043 |
| 2023 | US$ 90.729.107.012 | US$ 83.276.004.575 |
| 2022 | US$ 93.736.589.050 | US$ 103.224.756.800 |
| 2021 | US$ 66.318.146.546 | US$ 87.906.118.245 |
| 2020 | US$ 52.229.576.023 | US$ 64.053.810.078 |
| 2019 | US$ 66.197.682.052 | US$ 80.259.482.469 |
| 2018 | US$ 67.477.058.330 | US$ 75.766.598.613 |
| 2017 | US$ 54.041.327.349 | US$ 72.860.557.903 |
| 2016 | US$ 43.714.755.378 | US$ 69.842.604.407 |
| 2015 | US$ 52.581.502.969 | US$ 63.671.789.069 |
| 2014 | US$ 87.108.795.076 | US$ 75.818.867.911 |
| 2013 | US$ 91.381.274.046 | US$ 80.690.471.898 |
| 2012 | US$ 91.747.467.851 | US$ 88.655.850.854 |
| 2011 | US$ 89.503.237.238 | US$ 97.809.980.731 |
| 2010 | US$ 65.502.334.498 | US$ 80.208.867.996 |
| 2009 | US$ 48.243.335.560 | US$ 65.133.480.388 |
| 2008 | US$ 76.257.078.322 | US$ 79.762.958.392 |
| 2007 | US$ 51.704.450.816 | US$ 65.162.321.195 |
| 2006 | US$ 41.291.961.259 | US$ 53.550.250.227 |
| 2005 | US$ 30.386.570.590 | US$ 46.198.180.131 |
| 2004 | US$ 22.654.791.782 | US$ 39.266.996.606 |
| 2003 | US$ 14.928.755.904 | US$ 33.084.505.278 |
| 2002 | US$ 11.576.895.509 | US$ 27.736.610.298 |
| 2001 | US$ 10.166.980.822 | US$ 31.112.418.400 |
| 2000 | US$ 10.353.710.625 | US$ 31.223.690.400 |
| 1999 | US$ 7.163.702.505 | US$ 27.862.300.000 |
| 1998 | US$ 6.716.763.896 | US$ 31.137.200.000 |
| 1997 | US$ 7.739.646.727 | US$ 30.928.400.000 |
| 1996 | US$ 7.418.919.357 | US$ 28.381.400.000 |
| 1995 | US$ 7.940.652.378 | US$ 24.978.532.000 |
| 1994 | US$ 7.876.550.644 | US$ 19.385.100.000 |
| 1993 | US$ 8.871.031.904 | US$ 16.357.317.317 |
| 1992 | US$ 18.440.081.612 | US$ 15.095.261.860 |
| 1991 | - | US$ 14.561.091.033 |
| 1990 | - | US$ 14.643.479.947 |
| 1989 | - | US$ 10.006.623.327 |
| 1988 | - | US$ 12.094.686.105 |
| 1987 | - | US$ 8.566.904.947 |
| 1986 | - | US$ 8.641.279.278 |
| 1985 | - | US$ 10.345.475.059 |
| 1984 | - | US$ 8.873.730.059 |
| 1983 | - | US$ 9.515.669.467 |
| 1982 | - | US$ 7.663.966.256 |
| 1981 | - | US$ 5.445.263.190 |
| 1980 | - | US$ 3.895.791.555 |
| 1979 | - | US$ 4.508.960.597 |
| 1978 | - | US$ 7.665.724.160 |
| 1977 | - | US$ 5.459.999.881 |
| 1976 | - | US$ 4.695.000.304 |
| 1975 | - | US$ 3.054.054.017 |
| 1974 | - | US$ 4.999.999.840 |
| 1973 | - | US$ 4.000.000.136 |
| 1972 | - | US$ 2.500.000.047 |
| 1971 | - | US$ 2.000.000.003 |
| 1970 | - | US$ 1.769.210.603 |
| 1969 | - | US$ 2.000.000.041 |
| 1968 | - | US$ 1.714.285.705 |
| 1967 | - | US$ 1.818.181.858 |
| 1966 | - | US$ 1.904.761.830 |
| 1965 | - | US$ 1.764.705.803 |
| 1964 | - | US$ 1.424.603.255 |
| 1963 | - | US$ 1.441.753.550 |
| 1962 | - | US$ 860.375.634 |
| 1961 | - | US$ 1.206.915.940 |
| 1960 | - | US$ 1.206.418.458 |
As exportações de bens e serviços do Cazaquistão foram de US$ 92,1 bilhões (2024) e as da Argentina, de US$ 97,3 bilhões (2024): as da Argentina foram 5,7% maiores. Em 1992, as exportações do Cazaquistão foram 22% maiores: US$ 18,4 bilhões do Cazaquistão e US$ 15,1 bilhões da Argentina.
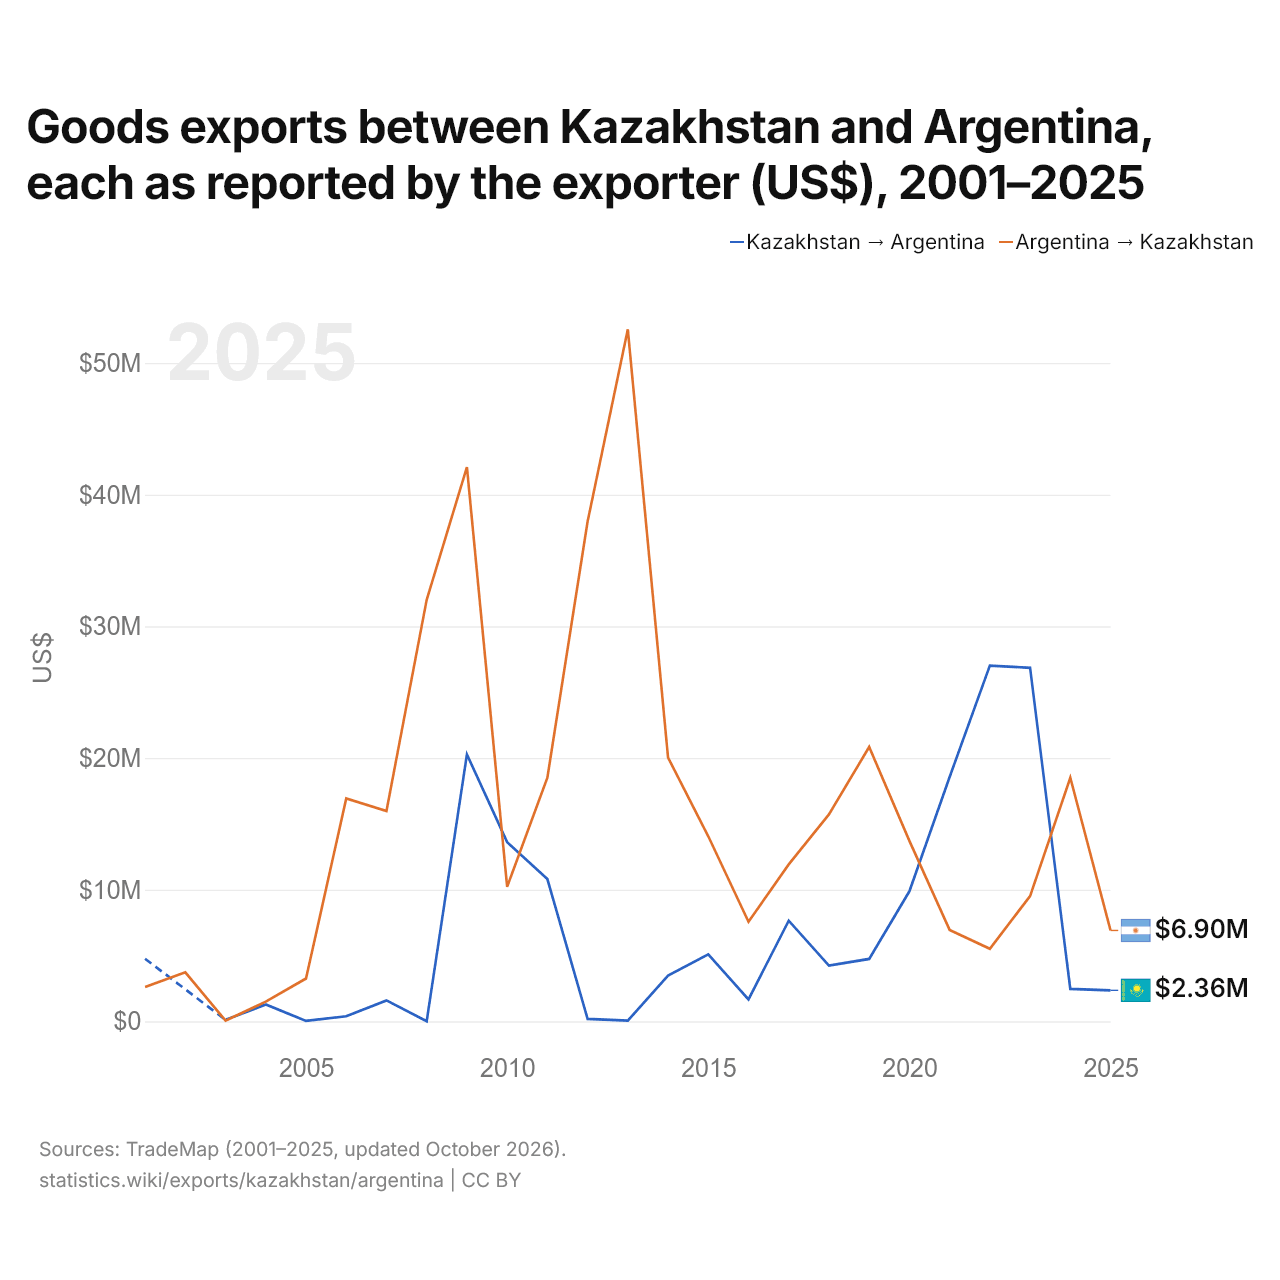
Exportações de bens entre o Cazaquistão e a Argentina, segundo o exportador (US$), 2001–2025
| Ano | US$ | |
|---|---|---|
| Cazaquistão → Argentina | Argentina → Cazaquistão | |
| 2025 | US$ 2.356.000 | US$ 6.903.000 |
| 2024 | US$ 2.462.000 | US$ 18.502.000 |
| 2023 | US$ 26.852.000 | US$ 9.514.000 |
| 2022 | US$ 27.023.000 | US$ 5.514.000 |
| 2021 | US$ 18.561.000 | US$ 6.947.000 |
| 2020 | US$ 9.875.000 | US$ 13.706.000 |
| 2019 | US$ 4.739.000 | US$ 20.841.000 |
| 2018 | US$ 4.236.000 | US$ 15.713.000 |
| 2017 | US$ 7.645.000 | US$ 11.917.000 |
| 2016 | US$ 1.662.000 | US$ 7.561.000 |
| 2015 | US$ 5.087.000 | US$ 14.056.000 |
| 2014 | US$ 3.478.000 | US$ 20.035.000 |
| 2013 | US$ 53.000 | US$ 52.565.000 |
| 2012 | US$ 187.000 | US$ 37.959.000 |
| 2011 | US$ 10.804.000 | US$ 18.505.000 |
| 2010 | US$ 13.611.000 | US$ 10.212.000 |
| 2009 | US$ 20.275.000 | US$ 42.097.000 |
| 2008 | US$ 9.000 | US$ 32.020.000 |
| 2007 | US$ 1.589.000 | US$ 15.978.000 |
| 2006 | US$ 382.000 | US$ 16.930.000 |
| 2005 | US$ 31.000 | US$ 3.252.000 |
| 2004 | US$ 1.281.000 | US$ 1.495.000 |
| 2003 | US$ 111.000 | US$ 52.000 |
| 2002 | - | US$ 3.721.000 |
| 2001 | US$ 4.754.000 | US$ 2.613.000 |
Em 2025, as exportações de bens do Cazaquistão para a Argentina, segundo o Cazaquistão, foram de US$ 2,36 milhões, e as da Argentina para o Cazaquistão, segundo a Argentina, de US$ 6,9 milhões: 2,9 vezes mais da Argentina. Em 2001, foram de US$ 4,75 milhões do Cazaquistão e de US$ 2,61 milhões da Argentina.
Cazaquistão vs Argentina: dados de exportações
|
Cazaquistão
|
Argentina
|
|
|---|---|---|
| Exportações | US$ 92,1 bi (2024) | US$ 106 bi (2025) |
| Posição mundial | 51/176 | 47/176 |
| Participação mundial | 0,28% | 0,3% |
| % do PIB | 31,6% | 15,6% |
| Maior categoria de bens | Petróleo, gás, minérios e outras matérias-primas (68,6%, 2025) | Alimentos processados, óleos, rações, bebidas e tabaco (25,6%, 2025) |
| Principal destino dos bens | Itália (19,7%, 2025) | Brasil (14,7%, 2025) |
Comparar as exportações de 2 países quaisquer
Fontes:
- Banco Mundial | Economy & Growth (1960–2025, atualizado em outubro de 2026)
- TradeMap (2001–2025, atualizado em outubro de 2026)
Creative Commons Atribuição (CC BY): você pode copiar, compartilhar, adaptar e reutilizar este conteúdo, inclusive para fins comerciais, desde que cite o statistics.wiki e indique as alterações que fizer. As fontes listadas acima podem ter suas próprias condições de licença.