
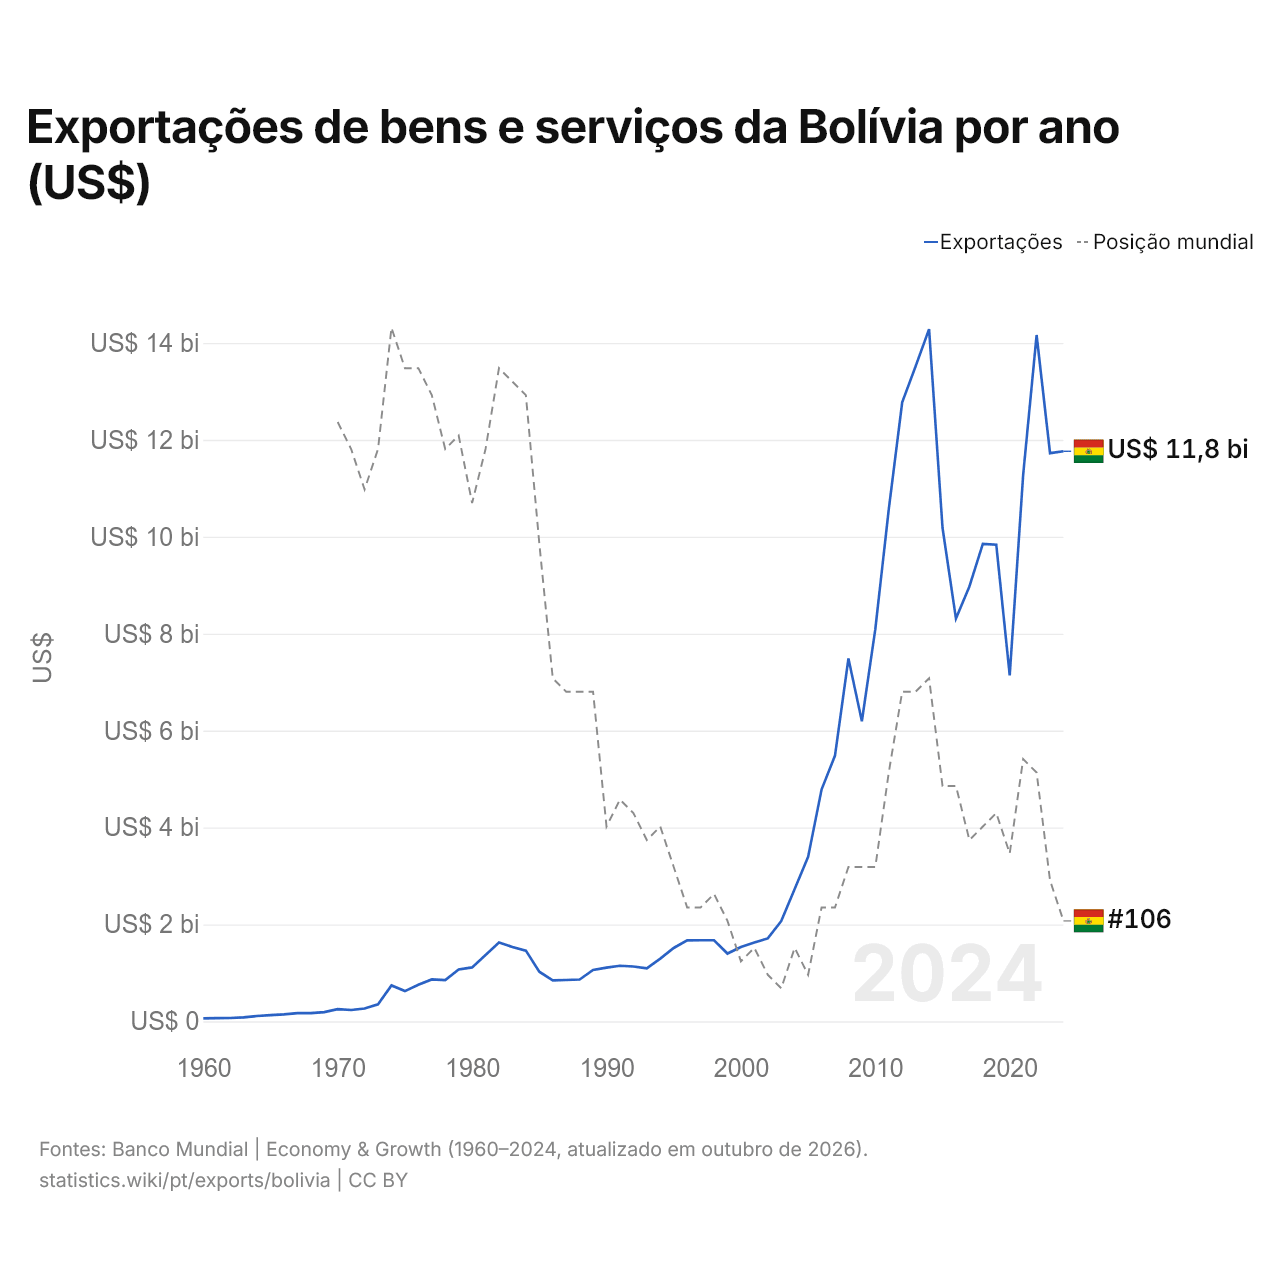
Exportações de bens e serviços da Bolívia por ano (US$)
| Ano | US$ | Posição mundial |
|---|---|---|
| Exportações | Posição mundial | |
| 2024 | US$ 11.763.846.802 | #106 |
| 2023 | US$ 11.725.676.874 | #103 |
| 2022 | US$ 14.163.562.909 | #95 |
| 2021 | US$ 11.276.448.090 | #94 |
| 2020 | US$ 7.139.077.207 | #101 |
| 2019 | US$ 9.834.601.158 | #98 |
| 2018 | US$ 9.854.706.136 | #99 |
| 2017 | US$ 8.973.701.187 | #100 |
| 2016 | US$ 8.311.504.863 | #96 |
| 2015 | US$ 10.186.598.886 | #96 |
| 2014 | US$ 14.285.068.712 | #88 |
| 2013 | US$ 13.518.462.721 | #89 |
| 2012 | US$ 12.774.727.337 | #89 |
| 2011 | US$ 10.565.767.133 | #95 |
| 2010 | US$ 8.093.221.340 | #102 |
| 2009 | US$ 6.194.300.356 | #102 |
| 2008 | US$ 7.487.843.217 | #102 |
| 2007 | US$ 5.483.635.309 | #105 |
| 2006 | US$ 4.783.631.931 | #105 |
| 2005 | US$ 3.394.535.859 | #110 |
| 2004 | US$ 2.731.911.668 | #108 |
| 2003 | US$ 2.069.153.669 | #111 |
| 2002 | US$ 1.710.308.633 | #110 |
| 2001 | US$ 1.626.035.911 | #108 |
| 2000 | US$ 1.534.686.673 | #109 |
| 1999 | US$ 1.398.593.388 | #106 |
| 1998 | US$ 1.673.894.695 | #104 |
| 1997 | US$ 1.673.170.826 | #105 |
| 1996 | US$ 1.670.369.478 | #105 |
| 1995 | US$ 1.514.364.435 | #102 |
| 1994 | US$ 1.295.730.954 | #99 |
| 1993 | US$ 1.094.224.544 | #100 |
| 1992 | US$ 1.131.356.484 | #98 |
| 1991 | US$ 1.147.697.877 | #97 |
| 1990 | US$ 1.108.688.419 | #99 |
| 1989 | US$ 1.061.009.896 | #89 |
| 1988 | US$ 862.854.458 | #89 |
| 1987 | US$ 853.524.498 | #89 |
| 1986 | US$ 844.299.281 | #88 |
| 1985 | US$ 1.024.367.606 | #78 |
| 1984 | US$ 1.459.382.832 | #67 |
| 1983 | US$ 1.535.522.169 | #66 |
| 1982 | US$ 1.625.898.083 | #65 |
| 1981 | US$ 1.370.758.564 | #71 |
| 1980 | US$ 1.112.928.222 | #75 |
| 1979 | US$ 1.068.844.960 | #70 |
| 1978 | US$ 849.175.412 | #71 |
| 1977 | US$ 864.117.941 | #67 |
| 1976 | US$ 756.121.939 | #65 |
| 1975 | US$ 623.738.131 | #65 |
| 1974 | US$ 741.229.385 | #62 |
| 1973 | US$ 350.024.988 | #71 |
| 1972 | US$ 265.513.351 | #74 |
| 1971 | US$ 234.343.434 | #71 |
| 1970 | US$ 250.168.350 | #69 |
| 1969 | US$ 189.814.815 | - |
| 1968 | US$ 169.696.970 | - |
| 1967 | US$ 170.033.670 | - |
| 1966 | US$ 142.255.892 | - |
| 1965 | US$ 129.713.805 | - |
| 1964 | US$ 110.437.710 | - |
| 1963 | US$ 81.986.532 | - |
| 1962 | US$ 67.929.293 | - |
| 1961 | US$ 67.255.892 | - |
| 1960 | US$ 61.111.111 | - |
As exportações de bens e serviços da Bolívia são de US$ 11,8 bilhões (2024), ante US$ 61,1 milhões em 1960. O máximo foi de US$ 14,3 bilhões, em 2014. São as 106ª maiores do mundo; no ano anterior, eram as 103ª. Sua melhor posição foi o 62º lugar, ocupado pela última vez em 1974.
As exportações de bens e serviços da Bolívia são as 17ª maiores de 27 países da América Latina (empatadas com El Salvador, cujo dado mais recente é de 2025). As importações de bens e serviços da Bolívia são de US$ 14 bilhões (2024), as 108ª maiores do mundo. As importações da Bolívia superam as exportações em US$ 2,25 bilhões, um déficit comercial (2024).
Exportações de bens da Bolívia por categoria, 2025
Exportações de bens, 2025: US$ 9,70 bi
Em 2025, a maior categoria das exportações de bens da Bolívia foi petróleo, gás, minérios e outras matérias-primas, com 52,7%, seguida de metais preciosos, pedras preciosas, joias, relógios, instrumentos musicais e arte, com 17,3%.
Destinos das exportações de bens da Bolívia: os 10 principais, 2025
| Posição | País | Exportações de bens | Participação | |
|---|---|---|---|---|
| 1 |
 China |
US$ 1,85 bi | 19,1% | |
| 2 |
 Brasil |
US$ 1,24 bi | 12,8% | vs Brasil |
| 3 |
 Índia |
US$ 823 mi | 8,49% | |
| 4 |
 Japão |
US$ 740 mi | 7,63% | |
| 5 |
 Peru |
US$ 585 mi | 6,04% | |
| 6 |
 Colômbia |
US$ 577 mi | 5,95% | |
| 7 |
 Estados Unidos |
US$ 421 mi | 4,34% | |
| 8 |
 Coreia do Sul |
US$ 404 mi | 4,16% | |
| 9 |
 Bélgica |
US$ 399 mi | 4,12% | |
| 10 |
 EAU |
US$ 352 mi | 3,63% | |
| Outros parceiros e não especificados | US$ 2,30 bi | 23,7% |
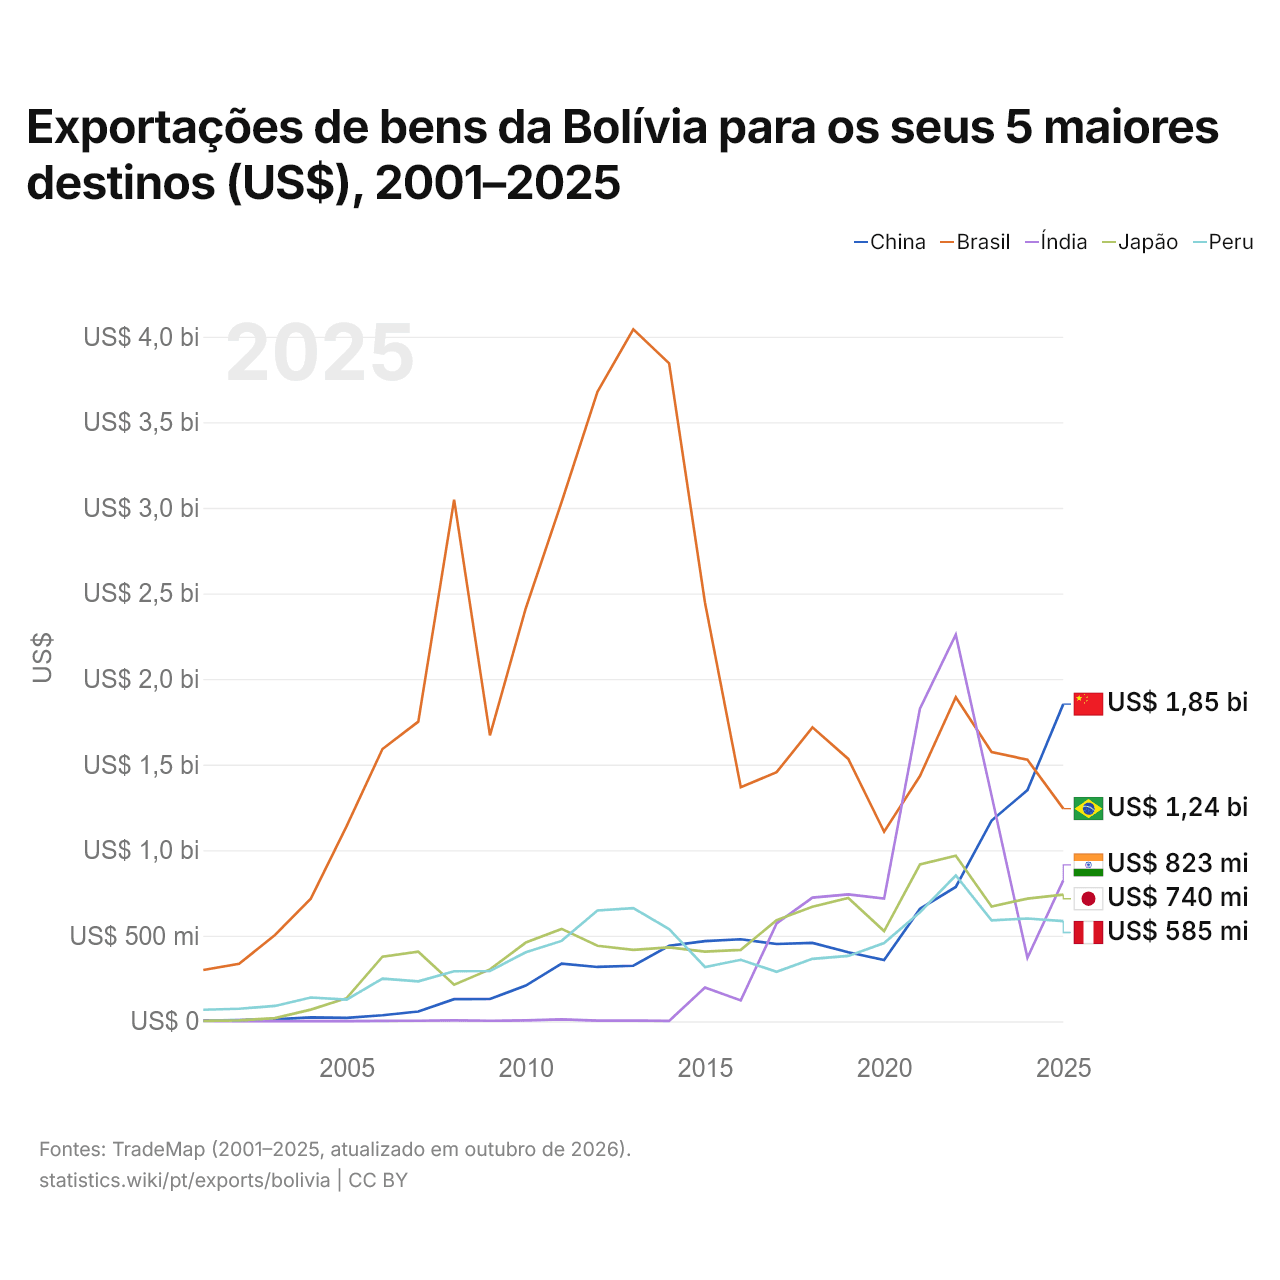
Exportações de bens da Bolívia para os seus 5 maiores destinos (US$), 2001–2025
| Ano | US$ | ||||
|---|---|---|---|---|---|
| China | Brasil | Índia | Japão | Peru | |
| 2025 | US$ 1.853.272.000 | US$ 1.242.629.000 | US$ 823.210.000 | US$ 740.497.000 | US$ 585.472.000 |
| 2024 | US$ 1.350.791.000 | US$ 1.528.032.000 | US$ 370.991.000 | US$ 716.984.000 | US$ 600.610.000 |
| 2023 | US$ 1.173.009.000 | US$ 1.573.434.000 | US$ 1.317.570.000 | US$ 671.264.000 | US$ 589.433.000 |
| 2022 | US$ 785.082.000 | US$ 1.893.716.000 | US$ 2.258.756.000 | US$ 967.003.000 | US$ 852.054.000 |
| 2021 | US$ 657.003.000 | US$ 1.433.199.000 | US$ 1.827.035.000 | US$ 916.097.000 | US$ 637.521.000 |
| 2020 | US$ 358.398.000 | US$ 1.107.610.000 | US$ 717.576.000 | US$ 527.390.000 | US$ 457.054.000 |
| 2019 | US$ 403.561.000 | US$ 1.533.261.000 | US$ 742.029.000 | US$ 720.930.000 | US$ 382.325.000 |
| 2018 | US$ 457.965.000 | US$ 1.717.589.000 | US$ 722.866.000 | US$ 669.557.000 | US$ 365.231.000 |
| 2017 | US$ 451.869.000 | US$ 1.455.672.000 | US$ 571.934.000 | US$ 591.350.000 | US$ 289.091.000 |
| 2016 | US$ 479.705.000 | US$ 1.367.693.000 | US$ 122.244.000 | US$ 417.296.000 | US$ 359.547.000 |
| 2015 | US$ 468.249.000 | US$ 2.447.485.000 | US$ 197.093.000 | US$ 407.223.000 | US$ 317.613.000 |
| 2014 | US$ 441.837.000 | US$ 3.844.108.000 | US$ 2.483.000 | US$ 432.335.000 | US$ 538.465.000 |
| 2013 | US$ 324.730.000 | US$ 4.043.249.000 | US$ 3.930.000 | US$ 417.721.000 | US$ 660.918.000 |
| 2012 | US$ 317.694.000 | US$ 3.678.152.000 | US$ 4.030.000 | US$ 441.840.000 | US$ 647.544.000 |
| 2011 | US$ 336.850.000 | US$ 3.034.053.000 | US$ 11.383.000 | US$ 540.026.000 | US$ 469.911.000 |
| 2010 | US$ 208.742.000 | US$ 2.413.681.000 | US$ 5.367.000 | US$ 460.298.000 | US$ 403.043.000 |
| 2009 | US$ 130.642.000 | US$ 1.670.795.000 | US$ 3.200.000 | US$ 303.543.000 | US$ 294.123.000 |
| 2008 | US$ 129.480.000 | US$ 3.047.525.000 | US$ 5.225.000 | US$ 214.374.000 | US$ 292.646.000 |
| 2007 | US$ 57.649.000 | US$ 1.750.715.000 | US$ 3.231.000 | US$ 407.198.000 | US$ 233.716.000 |
| 2006 | US$ 35.570.000 | US$ 1.590.979.000 | US$ 2.568.000 | US$ 377.962.000 | US$ 249.481.000 |
| 2005 | US$ 20.565.000 | US$ 1.140.274.000 | US$ 1.041.000 | US$ 135.140.000 | US$ 126.977.000 |
| 2004 | US$ 23.499.000 | US$ 716.396.000 | US$ 1.484.000 | US$ 68.404.000 | US$ 139.205.000 |
| 2003 | US$ 11.548.000 | US$ 503.969.000 | US$ 1.556.000 | US$ 18.579.000 | US$ 89.923.000 |
| 2002 | US$ 7.716.000 | US$ 336.568.000 | US$ 1.028.000 | US$ 5.864.000 | US$ 73.752.000 |
| 2001 | US$ 5.070.000 | US$ 299.550.000 | US$ 3.044.000 | US$ 2.812.000 | US$ 67.517.000 |
Em 2025, as exportações de bens foram de US$ 1,85 bilhão para a China, US$ 1,24 bilhão para o Brasil, US$ 823 milhões para a Índia, US$ 740 milhões para o Japão e US$ 585 milhões para o Peru. A mudança mais recente nessa ordem foi em 2025, quando as exportações da Bolívia para a China superaram as exportações para o Brasil.
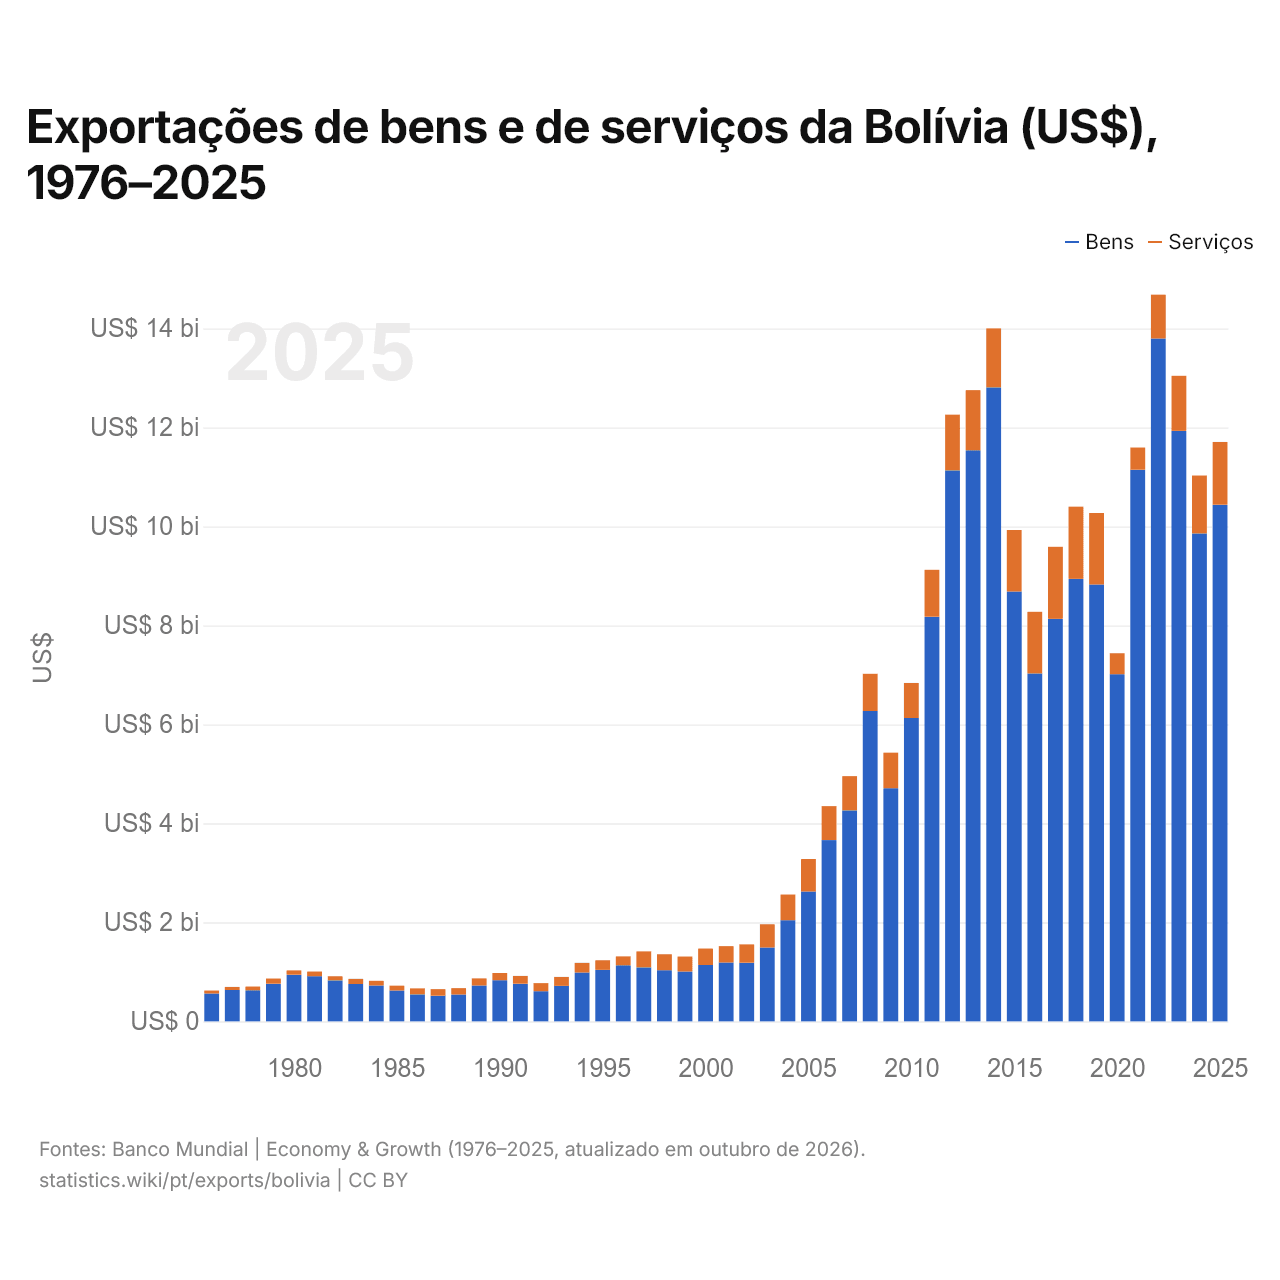
Exportações de bens e de serviços da Bolívia (US$), 1976–2025
| Ano | US$ | |
|---|---|---|
| Bens | Serviços | |
| 2025 | US$ 10.438.673.737 | US$ 1.268.050.451 |
| 2024 | US$ 9.858.576.101 | US$ 1.171.237.764 |
| 2023 | US$ 11.931.941.724 | US$ 1.111.040.406 |
| 2022 | US$ 13.794.787.928 | US$ 888.122.519 |
| 2021 | US$ 11.145.698.861 | US$ 449.143.893 |
| 2020 | US$ 7.013.096.617 | US$ 424.590.270 |
| 2019 | US$ 8.827.819.916 | US$ 1.443.285.123 |
| 2018 | US$ 8.940.200.489 | US$ 1.458.805.538 |
| 2017 | US$ 8.133.837.887 | US$ 1.454.951.846 |
| 2016 | US$ 7.029.946.630 | US$ 1.244.740.246 |
| 2015 | US$ 8.684.018.276 | US$ 1.243.394.801 |
| 2014 | US$ 12.809.705.325 | US$ 1.191.842.305 |
| 2013 | US$ 11.538.700.931 | US$ 1.213.954.466 |
| 2012 | US$ 11.132.827.855 | US$ 1.125.167.106 |
| 2011 | US$ 8.174.835.185 | US$ 948.038.342 |
| 2010 | US$ 6.129.300.487 | US$ 707.694.437 |
| 2009 | US$ 4.709.830.000 | US$ 720.130.000 |
| 2008 | US$ 6.271.446.254 | US$ 751.626.543 |
| 2007 | US$ 4.262.826.734 | US$ 691.908.733 |
| 2006 | US$ 3.661.955.401 | US$ 687.399.686 |
| 2005 | US$ 2.622.226.566 | US$ 657.166.440 |
| 2004 | US$ 2.044.256.551 | US$ 517.758.635 |
| 2003 | US$ 1.492.659.722 | US$ 468.545.314 |
| 2002 | US$ 1.184.341.416 | US$ 370.970.703 |
| 2001 | US$ 1.188.657.426 | US$ 332.040.844 |
| 2000 | US$ 1.139.092.096 | US$ 330.932.000 |
| 1999 | US$ 1.005.500.000 | US$ 305.100.000 |
| 1998 | US$ 1.032.000.000 | US$ 323.200.000 |
| 1997 | US$ 1.090.000.000 | US$ 323.840.000 |
| 1996 | US$ 1.131.990.000 | US$ 180.940.000 |
| 1995 | US$ 1.041.400.000 | US$ 192.400.000 |
| 1994 | US$ 985.100.000 | US$ 196.000.000 |
| 1993 | US$ 715.500.000 | US$ 181.400.000 |
| 1992 | US$ 608.400.000 | US$ 164.600.000 |
| 1991 | US$ 760.300.000 | US$ 157.000.000 |
| 1990 | US$ 830.800.000 | US$ 145.900.000 |
| 1989 | US$ 723.500.000 | US$ 143.300.000 |
| 1988 | US$ 542.500.000 | US$ 128.300.000 |
| 1987 | US$ 518.700.000 | US$ 131.500.000 |
| 1986 | US$ 545.500.000 | US$ 121.100.000 |
| 1985 | US$ 623.400.000 | US$ 96.500.000 |
| 1984 | US$ 724.500.000 | US$ 93.500.000 |
| 1983 | US$ 755.100.000 | US$ 103.000.000 |
| 1982 | US$ 827.700.000 | US$ 82.300.000 |
| 1981 | US$ 912.400.000 | US$ 93.000.000 |
| 1980 | US$ 942.200.000 | US$ 87.900.000 |
| 1979 | US$ 759.800.000 | US$ 105.200.000 |
| 1978 | US$ 627.300.000 | US$ 76.200.000 |
| 1977 | US$ 634.300.000 | US$ 60.800.000 |
| 1976 | US$ 563.000.000 | US$ 60.400.000 |
Em 2025, as exportações de bens da Bolívia foram de US$ 10,4 bilhões e as de serviços, de US$ 1,27 bilhão; os serviços representaram 10,8% do total, ante 9,7% em 1976.
A Bolívia na classificação mundial de exportações
| Posição | País | Exportações | Participação mundial | |
|---|---|---|---|---|
| 103 |
 Uganda |
US$ 13,3 bi (2025) | 0,04% | |
| 104 |
 Senegal |
US$ 12,0 bi (2025) | 0,03% | |
| 105 |
 Gabão |
US$ 11,9 bi (2025) | 0,03% | |
| 106 |
 Bolívia |
US$ 11,8 bi | 0,04% | |
| 107 |
 El Salvador |
US$ 11,8 bi (2025) | 0,03% | |
| 108 |
 Guiné |
US$ 11,7 bi (2025) | 0,03% | |
| 109 |
 Macedônia do Norte |
US$ 11,4 bi (2025) | 0,03% |
Exportações de bens e serviços da Bolívia, % do PIB
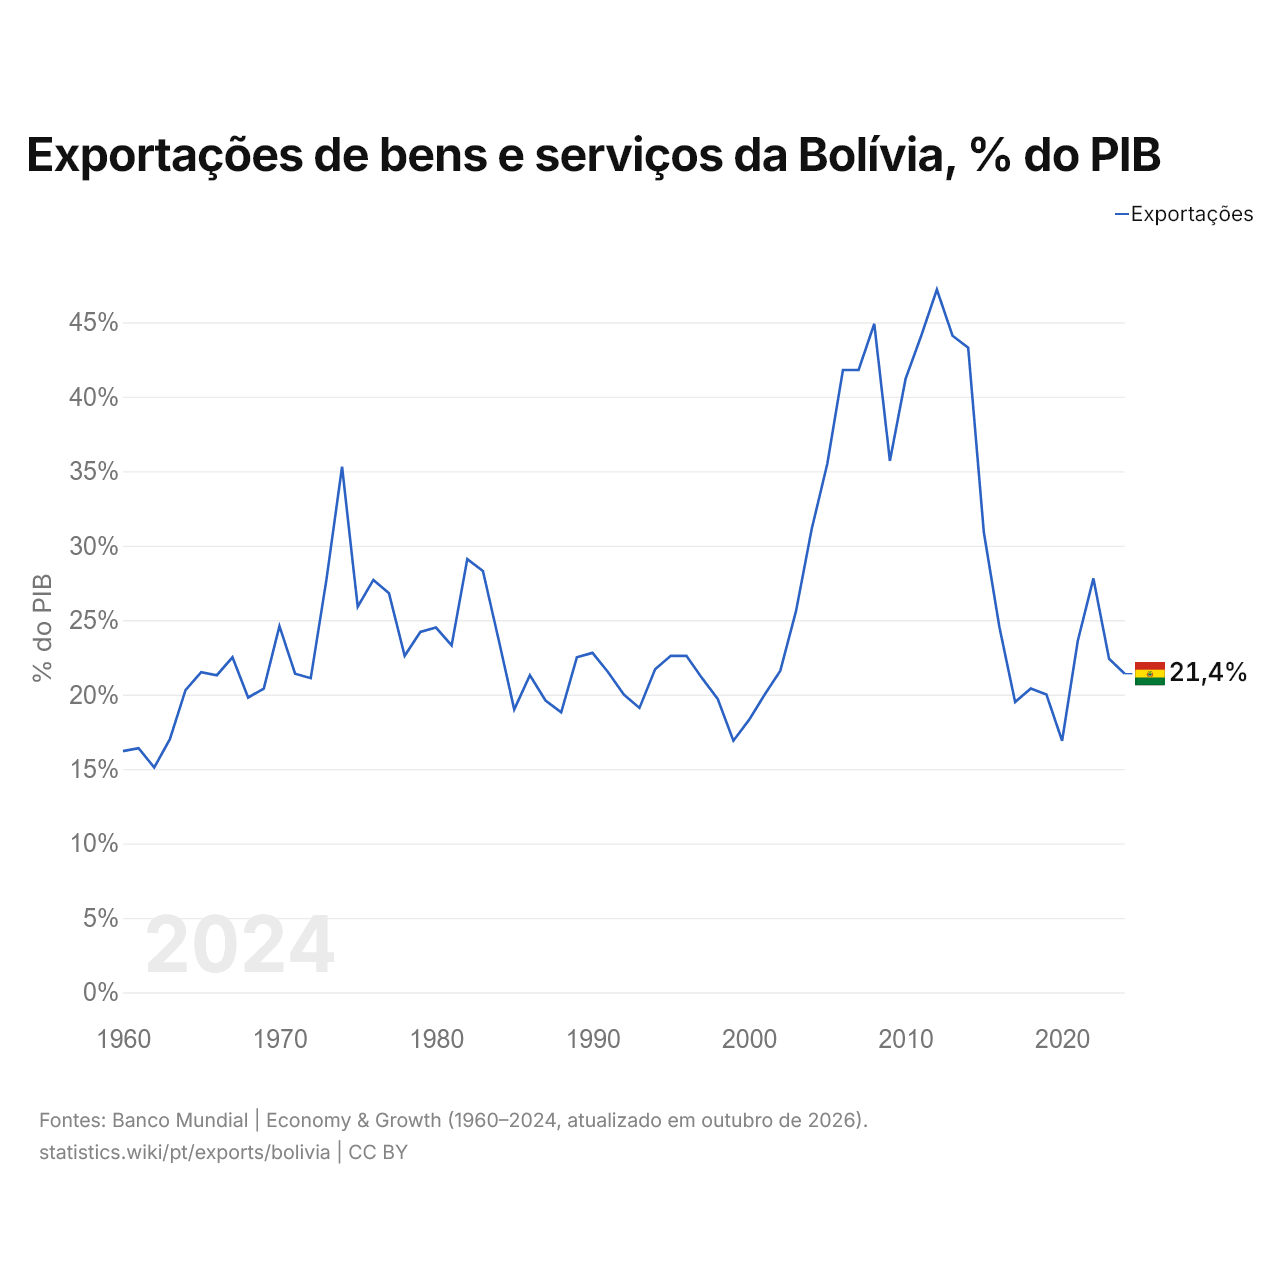
As exportações de bens e serviços da Bolívia equivalem a 21,4% do seu PIB (2024), ante 16,2% em 1960. A maior participação foi de 47,2%, em 2012.
Comparar as exportações da Bolívia com as de outros países
Fontes:
- Banco Mundial | Economy & Growth (1960–2025, atualizado em outubro de 2026)
- TradeMap (2001–2025, atualizado em outubro de 2026)
Creative Commons Atribuição (CC BY): você pode copiar, compartilhar, adaptar e reutilizar este conteúdo, inclusive para fins comerciais, desde que cite o statistics.wiki e indique as alterações que fizer. As fontes listadas acima podem ter suas próprias condições de licença.