
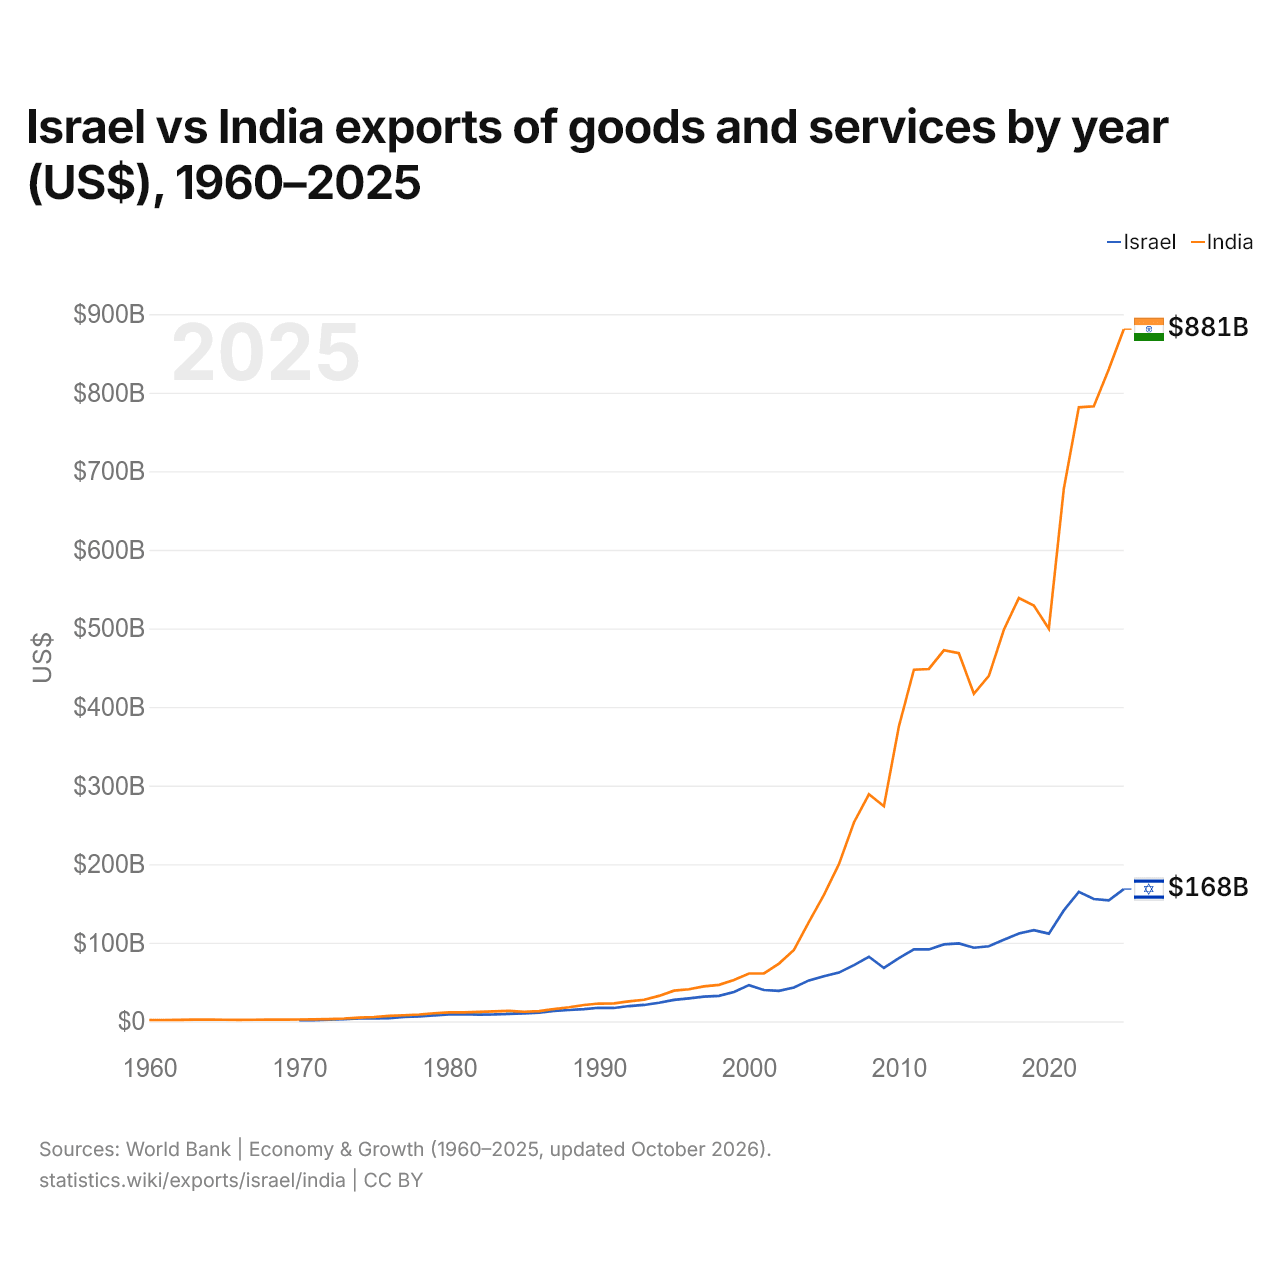
Israel vs Índia: exportações de bens e serviços por ano (US$), 1960–2025
| Ano | US$ | |
|---|---|---|
 Israel |
 Índia |
|
| 2025 | US$ 168.320.379.116 | US$ 880.740.846.622 |
| 2024 | US$ 154.003.411.595 | US$ 829.785.193.474 |
| 2023 | US$ 155.704.384.530 | US$ 782.620.610.192 |
| 2022 | US$ 164.717.379.095 | US$ 781.290.791.564 |
| 2021 | US$ 141.134.707.991 | US$ 677.769.255.429 |
| 2020 | US$ 111.580.807.004 | US$ 499.728.529.073 |
| 2019 | US$ 116.111.159.420 | US$ 529.245.063.167 |
| 2018 | US$ 111.732.613.655 | US$ 538.635.186.135 |
| 2017 | US$ 103.870.950.733 | US$ 498.258.808.232 |
| 2016 | US$ 95.603.619.692 | US$ 439.642.578.076 |
| 2015 | US$ 93.656.330.689 | US$ 416.787.940.848 |
| 2014 | US$ 99.195.918.584 | US$ 468.345.815.421 |
| 2013 | US$ 97.916.091.126 | US$ 472.180.271.340 |
| 2012 | US$ 91.513.991.201 | US$ 448.400.477.361 |
| 2011 | US$ 91.640.284.332 | US$ 447.384.417.625 |
| 2010 | US$ 80.360.492.381 | US$ 375.353.514.026 |
| 2009 | US$ 67.908.236.147 | US$ 273.752.124.889 |
| 2008 | US$ 82.239.708.194 | US$ 288.902.044.821 |
| 2007 | US$ 71.528.776.077 | US$ 253.077.526.013 |
| 2006 | US$ 62.029.475.291 | US$ 199.973.922.364 |
| 2005 | US$ 57.267.194.554 | US$ 160.838.260.681 |
| 2004 | US$ 52.102.634.315 | US$ 126.648.472.021 |
| 2003 | US$ 42.956.388.968 | US$ 90.838.575.244 |
| 2002 | US$ 38.693.354.933 | US$ 73.452.895.952 |
| 2001 | US$ 39.833.564.686 | US$ 60.963.415.577 |
| 2000 | US$ 46.101.675.864 | US$ 60.878.472.821 |
| 1999 | US$ 37.397.130.227 | US$ 52.544.483.403 |
| 1998 | US$ 32.433.118.076 | US$ 46.426.465.025 |
| 1997 | US$ 31.397.234.592 | US$ 44.459.225.643 |
| 1996 | US$ 29.283.354.325 | US$ 40.803.004.618 |
| 1995 | US$ 27.269.172.118 | US$ 39.068.855.118 |
| 1994 | US$ 23.692.120.155 | US$ 32.361.214.431 |
| 1993 | US$ 20.845.996.608 | US$ 27.466.541.463 |
| 1992 | US$ 19.453.754.626 | US$ 25.486.029.047 |
| 1991 | US$ 17.025.033.566 | US$ 22.943.398.073 |
| 1990 | US$ 17.331.518.699 | US$ 22.639.774.912 |
| 1989 | US$ 15.487.859.528 | US$ 20.770.696.112 |
| 1988 | US$ 14.461.397.211 | US$ 17.899.838.409 |
| 1987 | US$ 13.110.640.286 | US$ 15.638.662.914 |
| 1986 | US$ 11.055.703.724 | US$ 12.937.864.154 |
| 1985 | US$ 10.087.096.446 | US$ 12.217.447.522 |
| 1984 | US$ 9.523.963.165 | US$ 13.330.716.432 |
| 1983 | US$ 8.754.928.826 | US$ 12.741.335.281 |
| 1982 | US$ 8.537.572.016 | US$ 12.009.417.677 |
| 1981 | US$ 9.097.719.298 | US$ 11.485.699.151 |
| 1980 | US$ 8.875.098.039 | US$ 11.439.738.400 |
| 1979 | US$ 7.529.200.000 | US$ 10.326.638.766 |
| 1978 | US$ 6.385.882.353 | US$ 8.670.401.540 |
| 1977 | US$ 5.514.000.000 | US$ 7.754.701.054 |
| 1976 | US$ 4.155.000.000 | US$ 6.868.148.773 |
| 1975 | US$ 3.653.333.333 | US$ 5.560.878.503 |
| 1974 | US$ 3.690.000.000 | US$ 4.808.449.430 |
| 1973 | US$ 2.645.000.000 | US$ 3.599.236.351 |
| 1972 | US$ 2.117.500.000 | US$ 2.878.233.145 |
| 1971 | US$ 1.580.000.000 | US$ 2.469.914.214 |
| 1970 | US$ 1.516.666.667 | US$ 2.361.333.333 |
| 1969 | - | US$ 2.170.666.667 |
| 1968 | - | US$ 2.144.000.000 |
| 1967 | - | US$ 2.022.666.667 |
| 1966 | - | US$ 1.888.225.565 |
| 1965 | - | US$ 1.969.801.970 |
| 1964 | - | US$ 2.104.202.104 |
| 1963 | - | US$ 2.072.702.073 |
| 1962 | - | US$ 1.757.701.758 |
| 1961 | - | US$ 1.688.401.688 |
| 1960 | - | US$ 1.652.701.653 |
Em 2025, as exportações de bens e serviços de Israel foram de US$ 168 bilhões e as da Índia, de US$ 881 bilhões: as da Índia foram 5,2 vezes maiores. Em 1970, as exportações da Índia foram 1,6 vezes maiores: US$ 1,52 bilhão de Israel e US$ 2,36 bilhões da Índia.
As exportações de bens e serviços da Índia têm sido maiores que as de Israel todos os anos desde 1970.
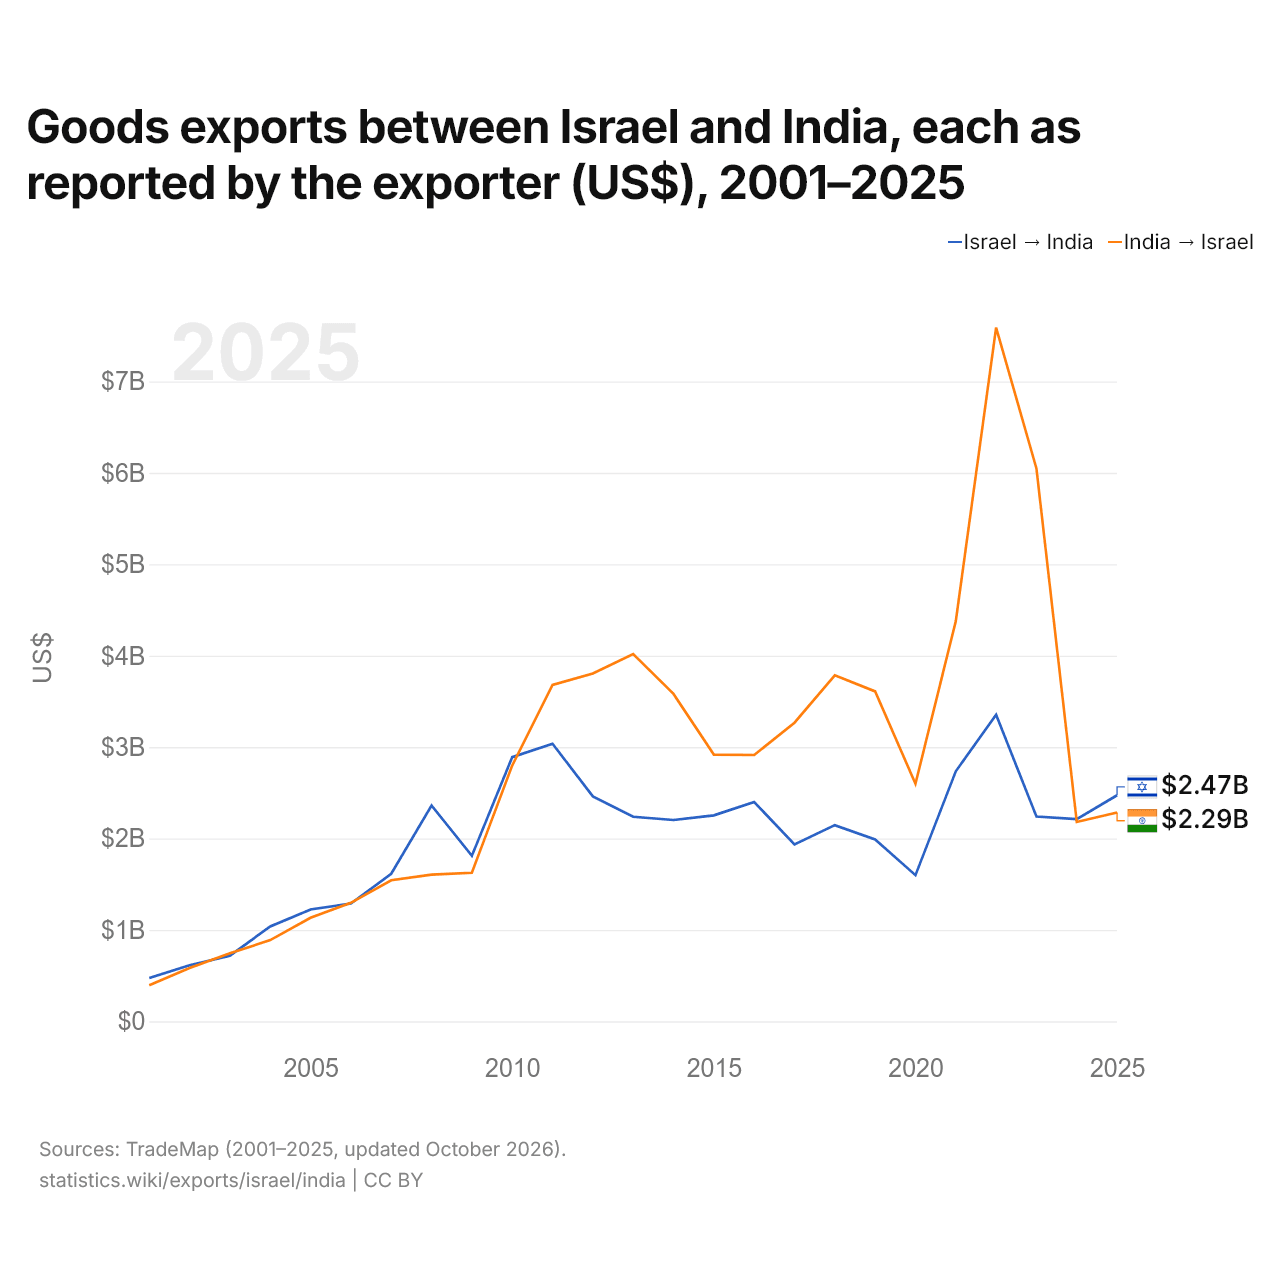
Exportações de bens entre Israel e a Índia, segundo o exportador (US$), 2001–2025
| Ano | US$ | |
|---|---|---|
| Israel → Índia | Índia → Israel | |
| 2025 | US$ 2.473.117.000 | US$ 2.285.156.000 |
| 2024 | US$ 2.211.745.000 | US$ 2.180.666.000 |
| 2023 | US$ 2.239.612.000 | US$ 6.047.496.000 |
| 2022 | US$ 3.354.491.000 | US$ 7.589.089.000 |
| 2021 | US$ 2.735.097.000 | US$ 4.377.883.000 |
| 2020 | US$ 1.598.998.000 | US$ 2.599.261.000 |
| 2019 | US$ 1.989.400.000 | US$ 3.608.902.000 |
| 2018 | US$ 2.146.323.000 | US$ 3.784.930.000 |
| 2017 | US$ 1.934.298.000 | US$ 3.266.093.000 |
| 2016 | US$ 2.399.407.000 | US$ 2.913.288.000 |
| 2015 | US$ 2.252.948.000 | US$ 2.918.195.000 |
| 2014 | US$ 2.202.593.000 | US$ 3.581.833.000 |
| 2013 | US$ 2.237.992.000 | US$ 4.016.550.000 |
| 2012 | US$ 2.460.832.000 | US$ 3.804.275.000 |
| 2011 | US$ 3.036.385.000 | US$ 3.680.764.000 |
| 2010 | US$ 2.890.155.000 | US$ 2.798.292.000 |
| 2009 | US$ 1.810.744.000 | US$ 1.624.868.000 |
| 2008 | US$ 2.361.225.000 | US$ 1.604.346.000 |
| 2007 | US$ 1.613.630.000 | US$ 1.543.455.000 |
| 2006 | US$ 1.289.329.000 | US$ 1.296.284.000 |
| 2005 | US$ 1.222.754.000 | US$ 1.133.325.000 |
| 2004 | US$ 1.037.793.000 | US$ 888.356.000 |
| 2003 | US$ 717.936.000 | US$ 743.659.000 |
| 2002 | US$ 613.829.000 | US$ 583.366.000 |
| 2001 | US$ 473.430.000 | US$ 393.836.000 |
Em 2025, as exportações de bens de Israel para a Índia, segundo Israel, foram de US$ 2,47 bilhões, e as da Índia para Israel, segundo a Índia, de US$ 2,29 bilhões: 8,2% mais de Israel. Em 2001, foram de US$ 473 milhões de Israel e de US$ 394 milhões da Índia.
Israel vs Índia: dados de exportações
|
Israel
|
Índia
|
|
|---|---|---|
| Exportações | US$ 168 bi (2025) | US$ 881 bi (2025) |
| Posição mundial | 37/176 | 10/176 |
| Participação mundial | 0,48% | 2,52% |
| % do PIB | 27,6% | 22,3% |
| Maior categoria de bens | Máquinas, eletrônicos e veículos (48,1%, 2025) | Máquinas, eletrônicos e veículos (28,5%, 2025) |
| Principal destino dos bens | Estados Unidos (27,4%, 2025) | Estados Unidos (20,7%, 2025) |
Comparar as exportações de 2 países quaisquer
Fontes:
- Banco Mundial | Economy & Growth (1960–2025, atualizado em outubro de 2026)
- TradeMap (2001–2025, atualizado em outubro de 2026)
Creative Commons Atribuição (CC BY): você pode copiar, compartilhar, adaptar e reutilizar este conteúdo, inclusive para fins comerciais, desde que cite o statistics.wiki e indique as alterações que fizer. As fontes listadas acima podem ter suas próprias condições de licença.