
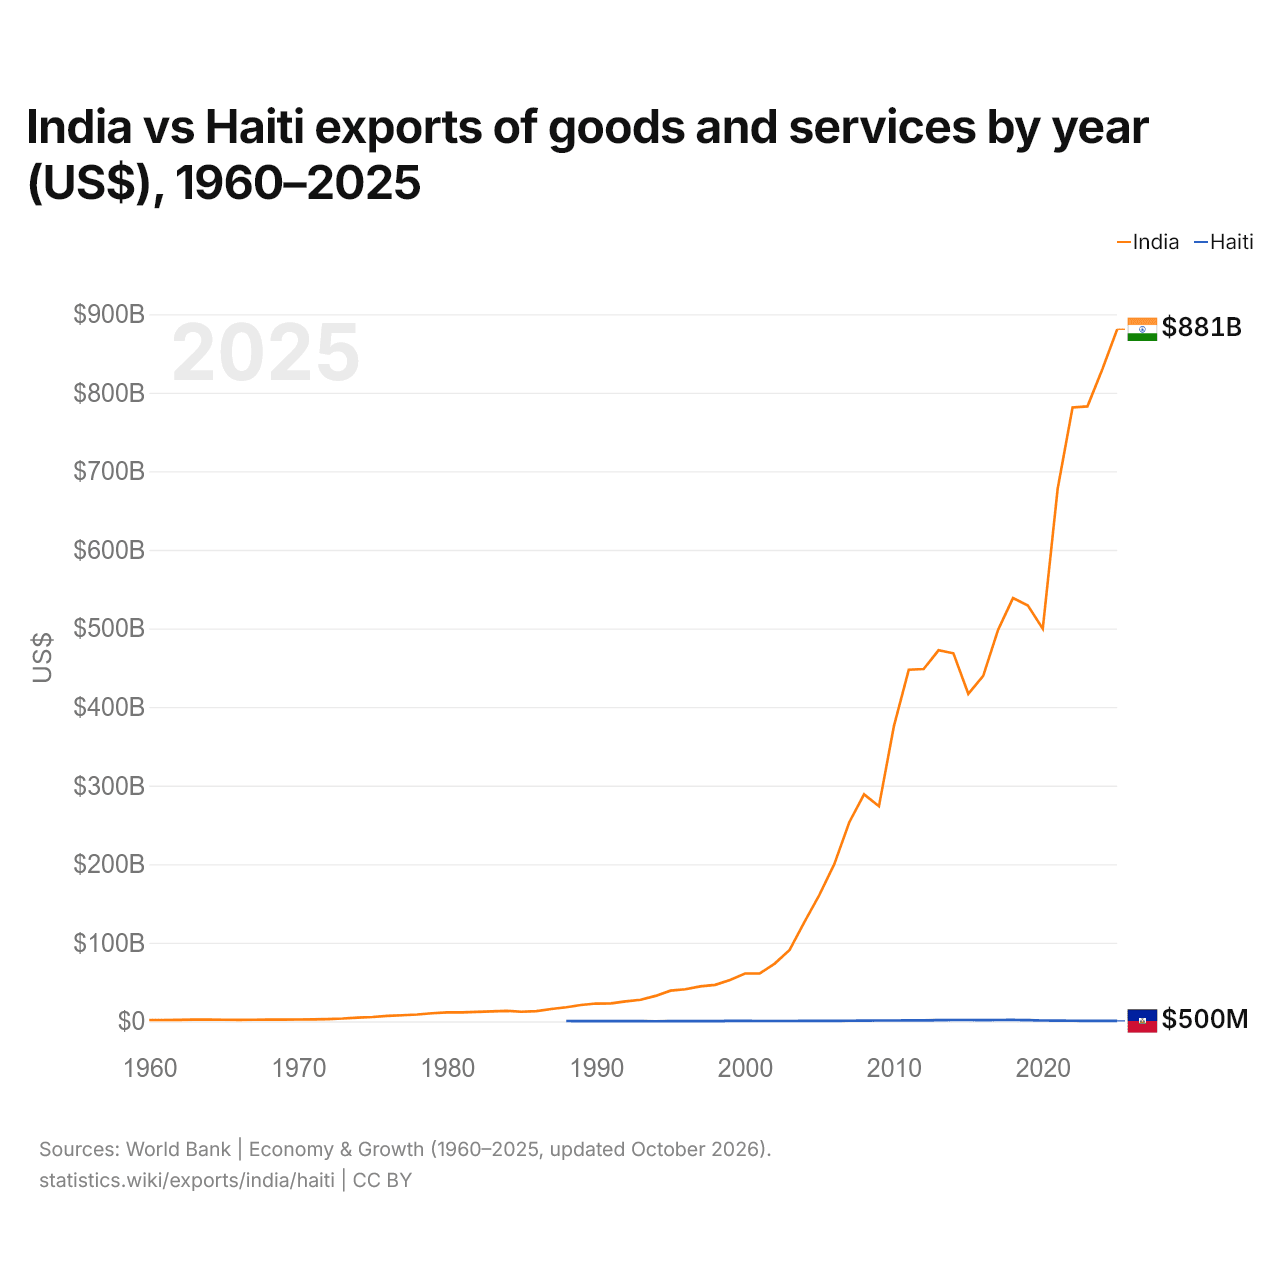
Índia vs Haiti: exportações de bens e serviços por ano (US$), 1960–2025
| Ano | US$ | |
|---|---|---|
 Índia |
 Haiti |
|
| 2025 | US$ 880.740.846.622 | US$ 500.396.995 |
| 2024 | US$ 829.785.193.474 | US$ 531.304.704 |
| 2023 | US$ 782.620.610.192 | US$ 626.235.384 |
| 2022 | US$ 781.290.791.564 | US$ 787.285.238 |
| 2021 | US$ 677.769.255.429 | US$ 903.284.255 |
| 2020 | US$ 499.728.529.073 | US$ 1.110.024.755 |
| 2019 | US$ 529.245.063.167 | US$ 1.585.349.843 |
| 2018 | US$ 538.635.186.135 | US$ 1.768.471.543 |
| 2017 | US$ 498.258.808.232 | US$ 1.660.793.079 |
| 2016 | US$ 439.642.578.076 | US$ 1.632.313.491 |
| 2015 | US$ 416.787.940.848 | US$ 1.747.466.805 |
| 2014 | US$ 468.345.815.421 | US$ 1.662.345.566 |
| 2013 | US$ 472.180.271.340 | US$ 1.567.188.287 |
| 2012 | US$ 448.400.477.361 | US$ 1.323.609.594 |
| 2011 | US$ 447.384.417.625 | US$ 1.311.686.715 |
| 2010 | US$ 375.353.514.026 | US$ 1.016.377.274 |
| 2009 | US$ 273.752.124.889 | US$ 1.034.002.204 |
| 2008 | US$ 288.902.044.821 | US$ 917.202.441 |
| 2007 | US$ 253.077.526.013 | US$ 779.237.502 |
| 2006 | US$ 199.973.922.364 | US$ 689.103.494 |
| 2005 | US$ 160.838.260.681 | US$ 605.106.729 |
| 2004 | US$ 126.648.472.021 | US$ 509.817.233 |
| 2003 | US$ 90.838.575.244 | US$ 470.293.089 |
| 2002 | US$ 73.452.895.952 | US$ 390.002.091 |
| 2001 | US$ 60.963.415.577 | US$ 444.869.994 |
| 2000 | US$ 60.878.472.821 | US$ 501.340.860 |
| 1999 | US$ 52.544.483.403 | US$ 508.794.534 |
| 1998 | US$ 46.426.465.025 | US$ 368.684.025 |
| 1997 | US$ 44.459.225.643 | US$ 349.005.073 |
| 1996 | US$ 40.803.004.618 | US$ 329.352.863 |
| 1995 | US$ 39.068.855.118 | US$ 256.955.765 |
| 1994 | US$ 32.361.214.431 | US$ 139.173.681 |
| 1993 | US$ 27.466.541.463 | US$ 203.703.198 |
| 1992 | US$ 25.486.029.047 | US$ 170.898.840 |
| 1991 | US$ 22.943.398.073 | US$ 358.174.517 |
| 1990 | US$ 22.639.774.912 | US$ 368.773.800 |
| 1989 | US$ 20.770.696.112 | US$ 356.133.600 |
| 1988 | US$ 17.899.838.409 | US$ 426.125.800 |
| 1987 | US$ 15.638.662.914 | - |
| 1986 | US$ 12.937.864.154 | - |
| 1985 | US$ 12.217.447.522 | - |
| 1984 | US$ 13.330.716.432 | - |
| 1983 | US$ 12.741.335.281 | - |
| 1982 | US$ 12.009.417.677 | - |
| 1981 | US$ 11.485.699.151 | - |
| 1980 | US$ 11.439.738.400 | - |
| 1979 | US$ 10.326.638.766 | - |
| 1978 | US$ 8.670.401.540 | - |
| 1977 | US$ 7.754.701.054 | - |
| 1976 | US$ 6.868.148.773 | - |
| 1975 | US$ 5.560.878.503 | - |
| 1974 | US$ 4.808.449.430 | - |
| 1973 | US$ 3.599.236.351 | - |
| 1972 | US$ 2.878.233.145 | - |
| 1971 | US$ 2.469.914.214 | - |
| 1970 | US$ 2.361.333.333 | - |
| 1969 | US$ 2.170.666.667 | - |
| 1968 | US$ 2.144.000.000 | - |
| 1967 | US$ 2.022.666.667 | - |
| 1966 | US$ 1.888.225.565 | - |
| 1965 | US$ 1.969.801.970 | - |
| 1964 | US$ 2.104.202.104 | - |
| 1963 | US$ 2.072.702.073 | - |
| 1962 | US$ 1.757.701.758 | - |
| 1961 | US$ 1.688.401.688 | - |
| 1960 | US$ 1.652.701.653 | - |
Em 2025, as exportações de bens e serviços da Índia foram de US$ 881 bilhões e as do Haiti, de US$ 500 milhões: as da Índia foram 1.800 vezes maiores. Em 1988, as exportações da Índia foram 42 vezes maiores: US$ 17,9 bilhões da Índia e US$ 426 milhões do Haiti.
As exportações de bens e serviços da Índia têm sido maiores que as do Haiti todos os anos desde 1988.
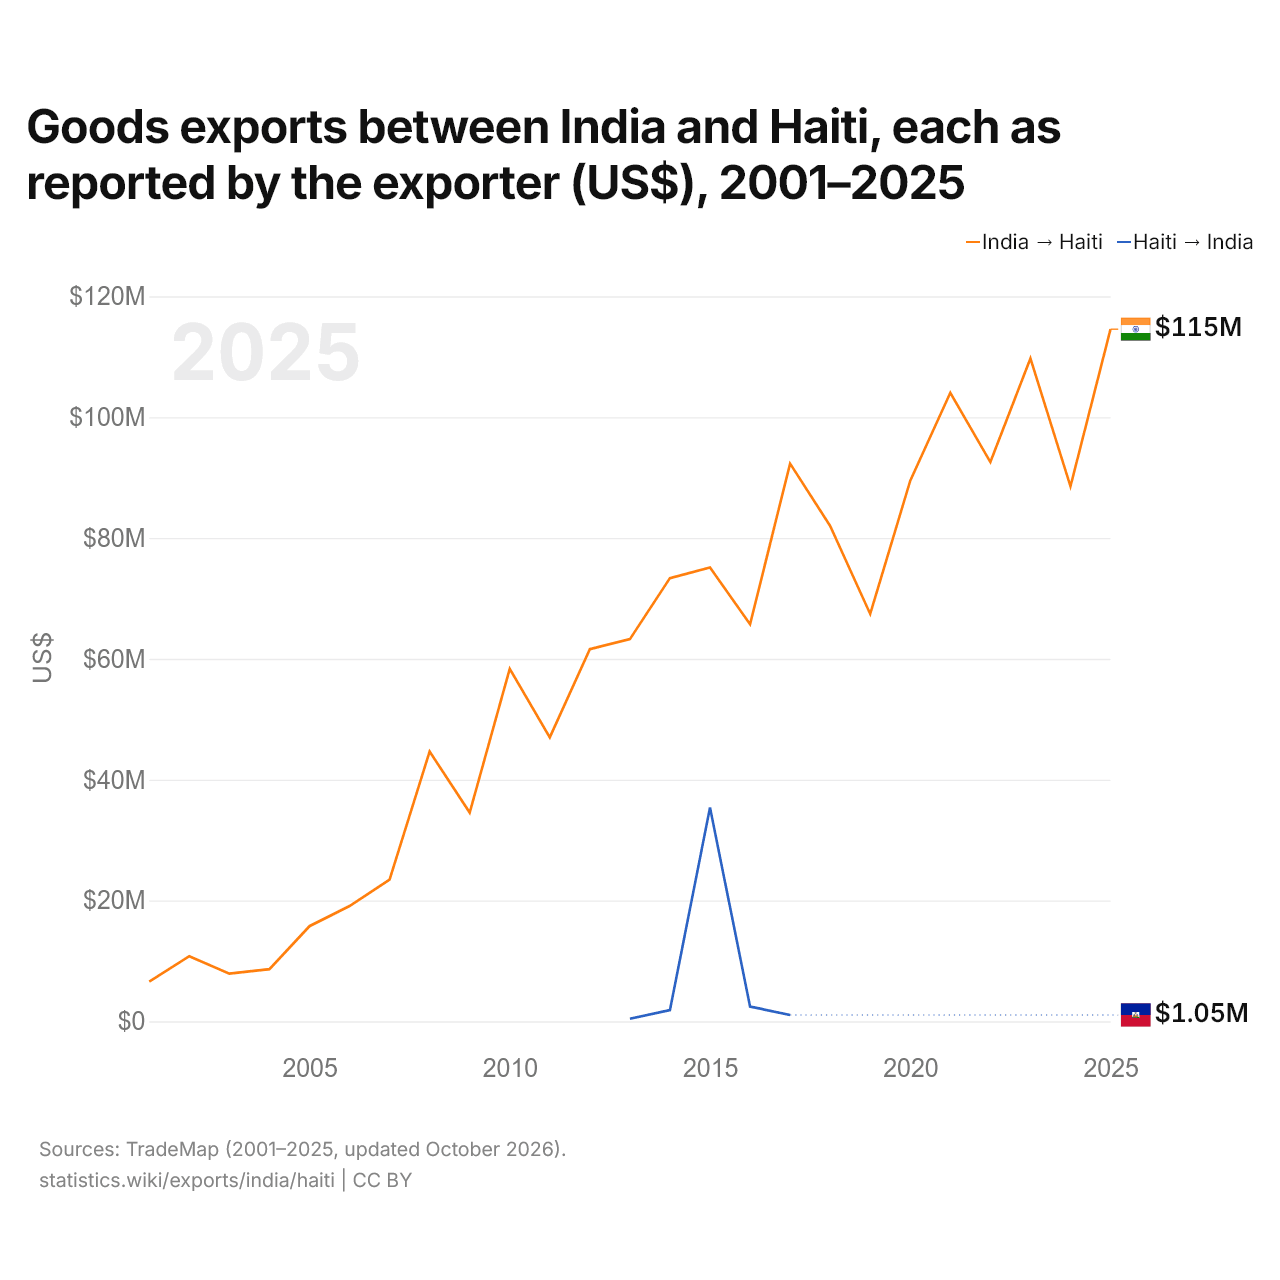
Exportações de bens entre a Índia e o Haiti, segundo o exportador (US$), 2001–2025
| Ano | US$ | |
|---|---|---|
| Índia → Haiti | Haiti → Índia | |
| 2025 | US$ 114.565.000 | - |
| 2024 | US$ 88.552.000 | - |
| 2023 | US$ 109.714.000 | - |
| 2022 | US$ 92.563.000 | - |
| 2021 | US$ 104.033.000 | - |
| 2020 | US$ 89.485.000 | - |
| 2019 | US$ 67.423.000 | - |
| 2018 | US$ 81.997.000 | - |
| 2017 | US$ 92.307.000 | US$ 1.054.000 |
| 2016 | US$ 65.718.000 | US$ 2.456.000 |
| 2015 | US$ 75.111.000 | US$ 35.401.000 |
| 2014 | US$ 73.359.000 | US$ 1.858.000 |
| 2013 | US$ 63.259.000 | US$ 437.000 |
| 2012 | US$ 61.589.000 | - |
| 2011 | US$ 46.996.000 | - |
| 2010 | US$ 58.338.000 | - |
| 2009 | US$ 34.544.000 | - |
| 2008 | US$ 44.660.000 | - |
| 2007 | US$ 23.438.000 | - |
| 2006 | US$ 19.087.000 | - |
| 2005 | US$ 15.743.000 | - |
| 2004 | US$ 8.638.000 | - |
| 2003 | US$ 7.889.000 | - |
| 2002 | US$ 10.780.000 | - |
| 2001 | US$ 6.554.000 | - |
As exportações de bens da Índia para o Haiti, segundo a Índia, foram de US$ 92,3 milhões, e as do Haiti para a Índia, segundo o Haiti, de US$ 1,05 milhão: 88 vezes mais da Índia. Em 2013, foram de US$ 63,3 milhões da Índia e de US$ 437.000 do Haiti.
Índia vs Haiti: dados de exportações
|
Índia
|
Haiti
|
|
|---|---|---|
| Exportações | US$ 881 bi (2025) | US$ 500 mi (2025) |
| Posição mundial | 10/176 | 163/176 |
| Participação mundial | 2,52% | 0,001% |
| % do PIB | 22,3% | 1,6% |
| Maior categoria de bens | Máquinas, eletrônicos e veículos (28,5%, 2025) | Têxteis, roupas, calçados, móveis e brinquedos (24,8%, 2017) |
| Principal destino dos bens | Estados Unidos (20,7%, 2025) | Estados Unidos (56,4%, 2017) |
Comparar as exportações de 2 países quaisquer
Fontes:
- Banco Mundial | Economy & Growth (1960–2025, atualizado em outubro de 2026)
- TradeMap (2001–2025, atualizado em outubro de 2026)
Creative Commons Atribuição (CC BY): você pode copiar, compartilhar, adaptar e reutilizar este conteúdo, inclusive para fins comerciais, desde que cite o statistics.wiki e indique as alterações que fizer. As fontes listadas acima podem ter suas próprias condições de licença.