
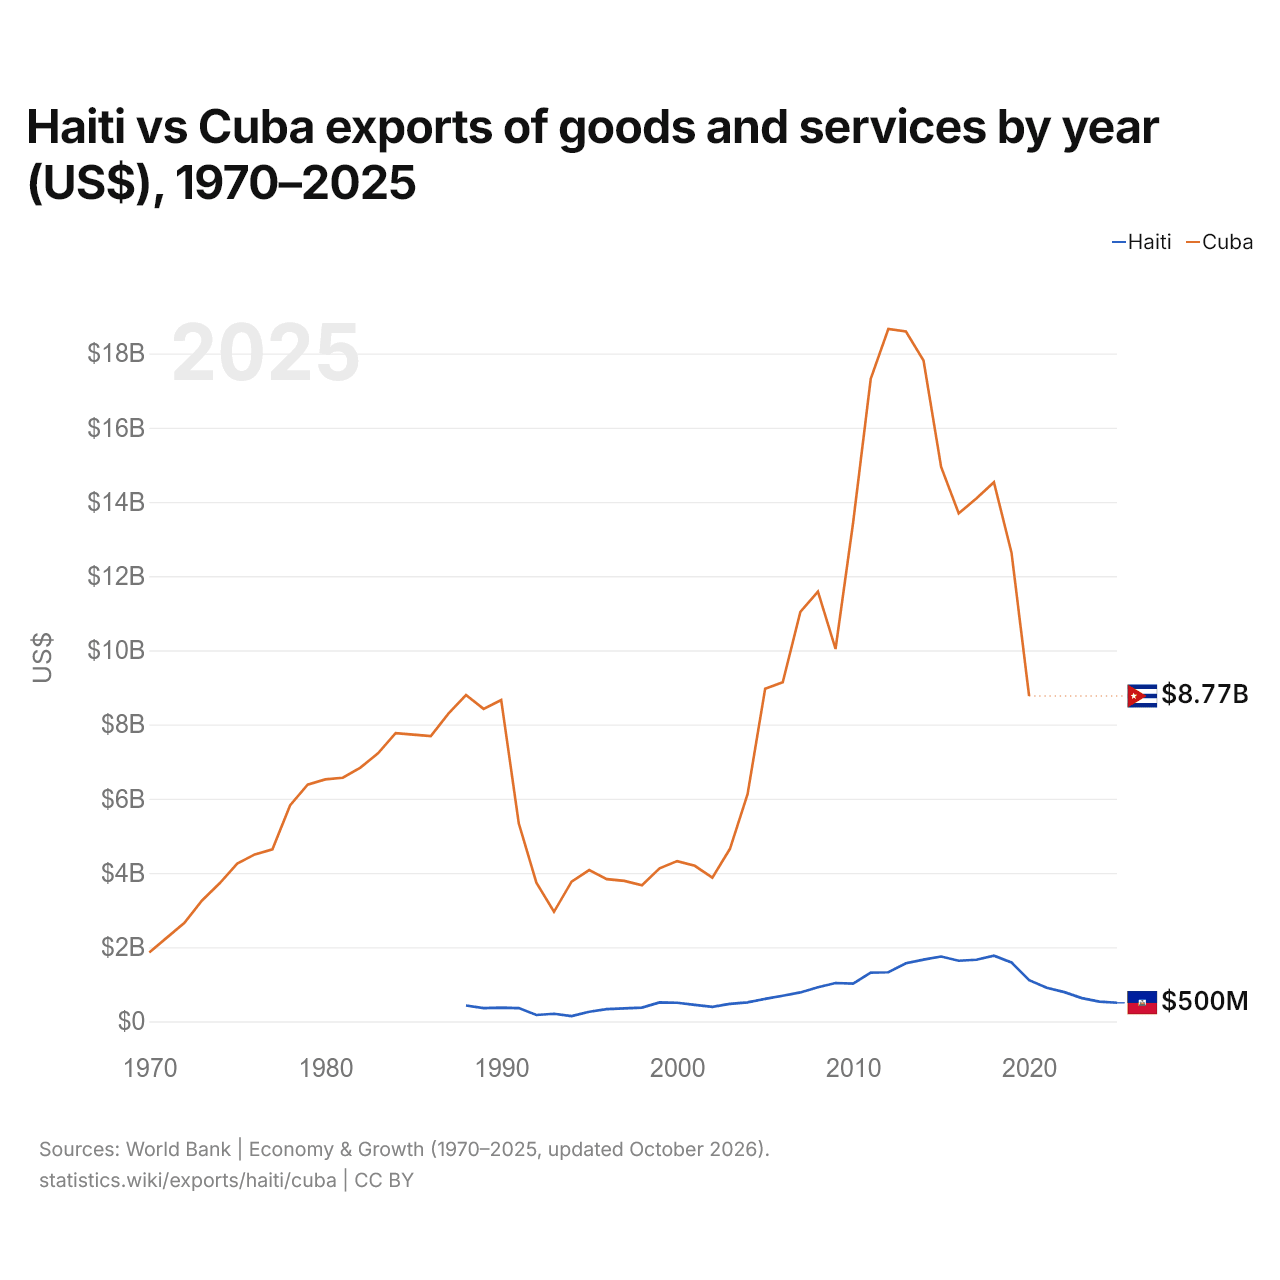
Haiti vs Cuba: exportações de bens e serviços por ano (US$), 1970–2025
| Ano | US$ | |
|---|---|---|
 Haiti |
 Cuba |
|
| 2025 | US$ 500.396.995 | - |
| 2024 | US$ 531.304.704 | - |
| 2023 | US$ 626.235.384 | - |
| 2022 | US$ 787.285.238 | - |
| 2021 | US$ 903.284.255 | - |
| 2020 | US$ 1.110.024.755 | US$ 8.769.000.000 |
| 2019 | US$ 1.585.349.843 | US$ 12.632.000.000 |
| 2018 | US$ 1.768.471.543 | US$ 14.530.000.000 |
| 2017 | US$ 1.660.793.079 | US$ 14.093.000.000 |
| 2016 | US$ 1.632.313.491 | US$ 13.689.600.000 |
| 2015 | US$ 1.747.466.805 | US$ 14.941.000.000 |
| 2014 | US$ 1.662.345.566 | US$ 17.812.000.000 |
| 2013 | US$ 1.567.188.287 | US$ 18.593.000.000 |
| 2012 | US$ 1.323.609.594 | US$ 18.659.000.000 |
| 2011 | US$ 1.311.686.715 | US$ 17.319.000.000 |
| 2010 | US$ 1.016.377.274 | US$ 13.443.518.519 |
| 2009 | US$ 1.034.002.204 | US$ 10.036.111.111 |
| 2008 | US$ 917.202.441 | US$ 11.580.000.000 |
| 2007 | US$ 779.237.502 | US$ 11.035.092.593 |
| 2006 | US$ 689.103.494 | US$ 9.138.888.889 |
| 2005 | US$ 605.106.729 | US$ 8.962.900.000 |
| 2004 | US$ 509.817.233 | US$ 6.120.800.000 |
| 2003 | US$ 470.293.089 | US$ 4.649.900.000 |
| 2002 | US$ 390.002.091 | US$ 3.872.000.000 |
| 2001 | US$ 444.869.994 | US$ 4.193.000.000 |
| 2000 | US$ 501.340.860 | US$ 4.318.900.000 |
| 1999 | US$ 508.794.534 | US$ 4.123.500.000 |
| 1998 | US$ 368.684.025 | US$ 3.668.100.000 |
| 1997 | US$ 349.005.073 | US$ 3.785.600.000 |
| 1996 | US$ 329.352.863 | US$ 3.831.000.000 |
| 1995 | US$ 256.955.765 | US$ 4.078.053.747 |
| 1994 | US$ 139.173.681 | US$ 3.766.477.027 |
| 1993 | US$ 203.703.198 | US$ 2.951.182.568 |
| 1992 | US$ 170.898.840 | US$ 3.736.544.459 |
| 1991 | US$ 358.174.517 | US$ 5.332.907.602 |
| 1990 | US$ 368.773.800 | US$ 8.662.106.516 |
| 1989 | US$ 356.133.600 | US$ 8.421.585.288 |
| 1988 | US$ 426.125.800 | US$ 8.794.332.850 |
| 1987 | - | US$ 8.295.404.426 |
| 1986 | - | US$ 7.687.511.279 |
| 1985 | - | US$ 7.725.366.416 |
| 1984 | - | US$ 7.766.066.363 |
| 1983 | - | US$ 7.224.138.184 |
| 1982 | - | US$ 6.838.236.471 |
| 1981 | - | US$ 6.565.420.000 |
| 1980 | - | US$ 6.521.956.667 |
| 1979 | - | US$ 6.377.068.904 |
| 1978 | - | US$ 5.819.724.675 |
| 1977 | - | US$ 4.635.330.843 |
| 1976 | - | US$ 4.499.232.765 |
| 1975 | - | US$ 4.251.739.756 |
| 1974 | - | US$ 3.719.910.244 |
| 1973 | - | US$ 3.258.402.051 |
| 1972 | - | US$ 2.654.199.161 |
| 1971 | - | US$ 2.255.959.900 |
| 1970 | - | US$ 1.857.363.400 |
As exportações de bens e serviços do Haiti são de US$ 500 milhões (2025), e as de Cuba, de US$ 8,77 bilhões (2020). Em 1988, as exportações de Cuba foram 21 vezes maiores: US$ 426 milhões do Haiti e US$ 8,79 bilhões de Cuba.
As exportações de bens e serviços de Cuba têm sido maiores que as do Haiti todos os anos desde 1988.
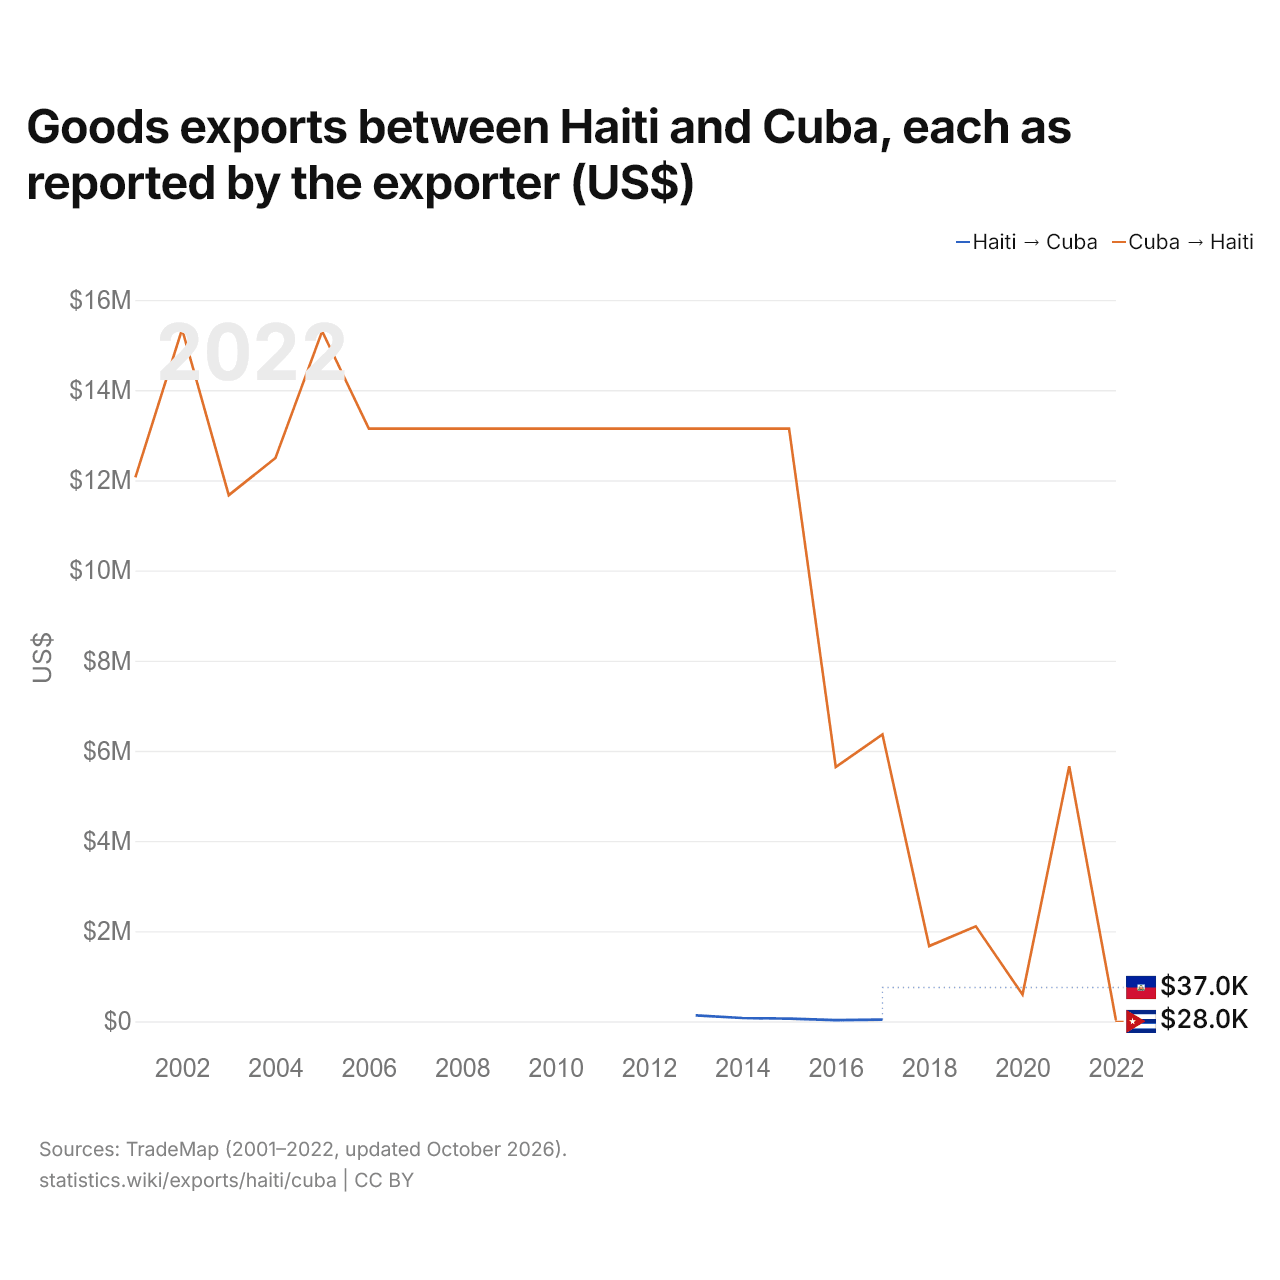
Exportações de bens entre o Haiti e Cuba, segundo o exportador (US$)
| Ano | US$ | |
|---|---|---|
| Haiti → Cuba | Cuba → Haiti | |
| 2022 | - | US$ 28.000 |
| 2021 | - | US$ 5.659.000 |
| 2020 | - | US$ 593.000 |
| 2019 | - | US$ 2.107.000 |
| 2018 | - | US$ 1.669.000 |
| 2017 | US$ 37.000 | US$ 6.364.000 |
| 2016 | US$ 27.000 | US$ 5.640.000 |
| 2015 | US$ 59.000 | US$ 13.147.000 |
| 2014 | US$ 74.000 | US$ 13.147.000 |
| 2013 | US$ 132.000 | US$ 13.147.000 |
| 2012 | - | US$ 13.147.000 |
| 2011 | - | US$ 13.147.000 |
| 2010 | - | US$ 13.147.000 |
| 2009 | - | US$ 13.147.000 |
| 2008 | - | US$ 13.147.000 |
| 2007 | - | US$ 13.147.000 |
| 2006 | - | US$ 13.147.000 |
| 2005 | - | US$ 15.306.000 |
| 2004 | - | US$ 12.495.000 |
| 2003 | - | US$ 11.670.000 |
| 2002 | - | US$ 15.351.000 |
| 2001 | - | US$ 12.064.000 |
As exportações de bens do Haiti para Cuba, segundo o Haiti, foram de US$ 37.000, e as de Cuba para o Haiti, segundo Cuba, de US$ 6,36 milhões: 170 vezes mais de Cuba. Em 2013, foram de US$ 132.000 do Haiti e de US$ 13,1 milhões de Cuba.
Haiti vs Cuba: dados de exportações
|
Haiti
|
Cuba
|
|
|---|---|---|
| Exportações | US$ 500 mi (2025) | US$ 8,77 bi (2020) |
| Posição mundial | 163/176 | 117/176 |
| Participação mundial | 0,001% | 0,04% |
| % do PIB | 1,6% | 8,2% |
| Maior categoria de bens | Têxteis, roupas, calçados, móveis e brinquedos (24,8%, 2017) | Metais comuns (ferro, aço, cobre, alumínio) (53,4%, 2022) |
| Principal destino dos bens | Estados Unidos (56,4%, 2017) | Espanha (16%, 2022) |
Comparar as exportações de 2 países quaisquer
Fontes:
- Banco Mundial | Economy & Growth (1970–2025, atualizado em outubro de 2026)
- TradeMap (2001–2022, atualizado em outubro de 2026)
Creative Commons Atribuição (CC BY): você pode copiar, compartilhar, adaptar e reutilizar este conteúdo, inclusive para fins comerciais, desde que cite o statistics.wiki e indique as alterações que fizer. As fontes listadas acima podem ter suas próprias condições de licença.