
World population by age and sex, 1950–2100
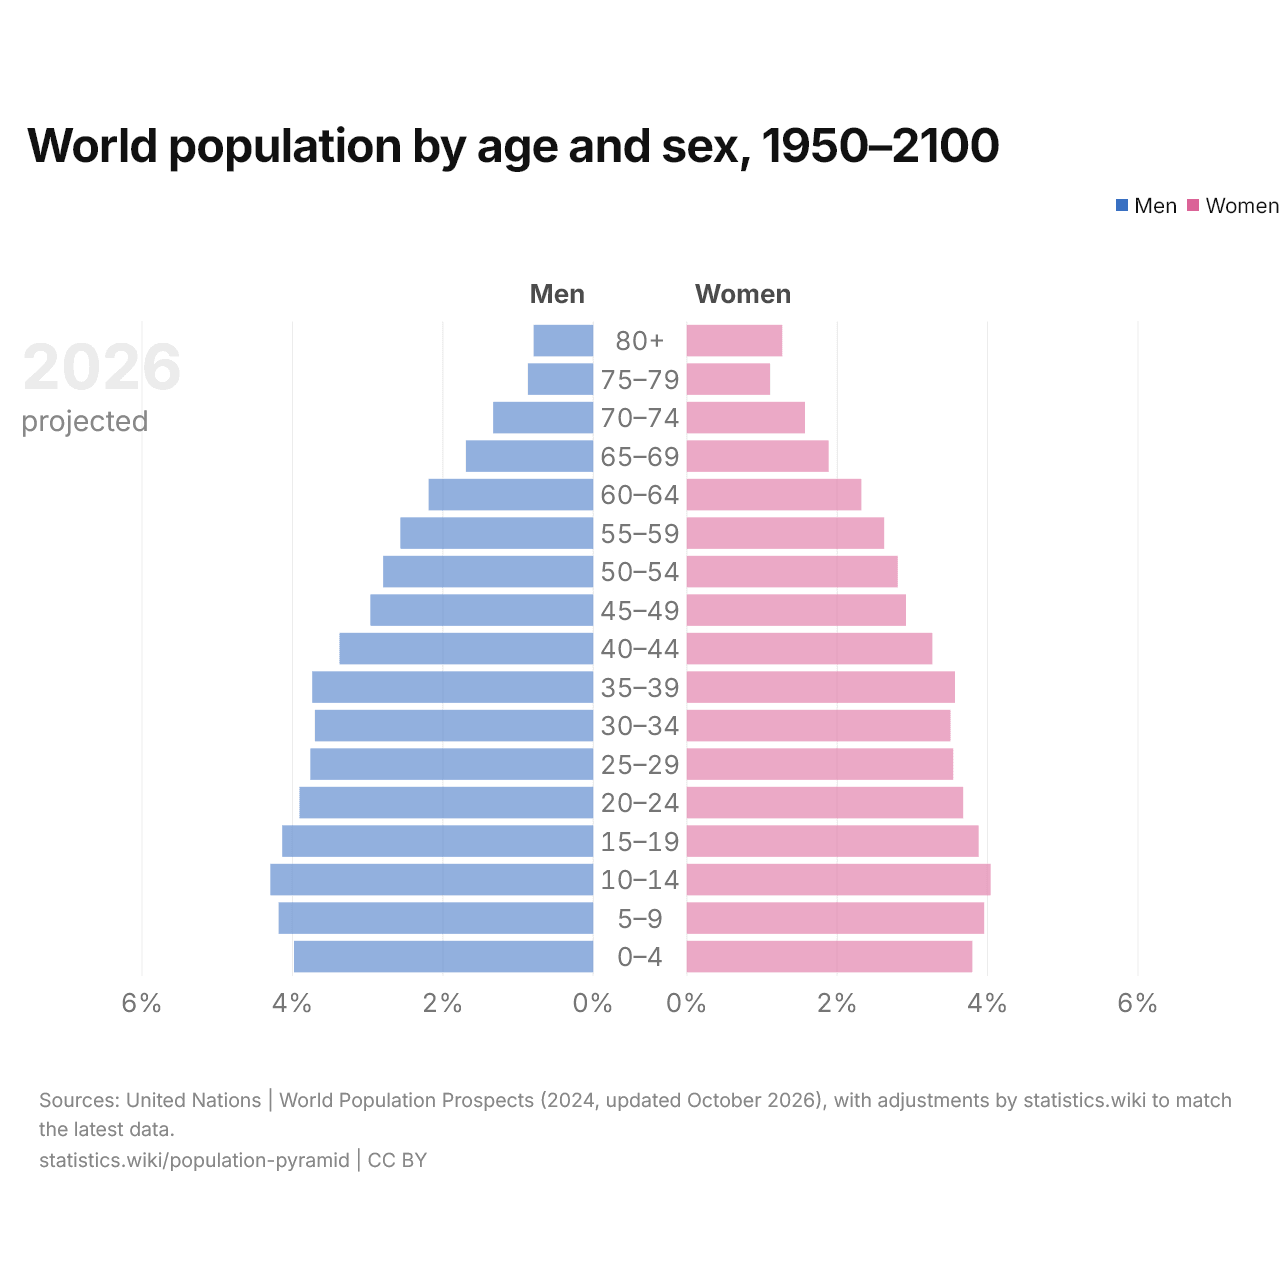
| Age (2026 projected) | Men | Women | Men, % of population | Women, % of population |
|---|---|---|---|---|
| 80+ | 65.6M | 105M | 0.8% | 1.3% |
| 75–79 | 71.8M | 91.6M | 0.9% | 1.1% |
| 70–74 | 110M | 130M | 1.3% | 1.6% |
| 65–69 | 140M | 156M | 1.7% | 1.9% |
| 60–64 | 181M | 192M | 2.2% | 2.3% |
| 55–59 | 212M | 217M | 2.6% | 2.6% |
| 50–54 | 231M | 232M | 2.8% | 2.8% |
| 45–49 | 245M | 241M | 3.0% | 2.9% |
| 40–44 | 279M | 270M | 3.4% | 3.3% |
| 35–39 | 309M | 295M | 3.7% | 3.6% |
| 30–34 | 306M | 290M | 3.7% | 3.5% |
| 25–29 | 311M | 293M | 3.8% | 3.5% |
| 20–24 | 323M | 304M | 3.9% | 3.7% |
| 15–19 | 342M | 321M | 4.1% | 3.9% |
| 10–14 | 355M | 334M | 4.3% | 4.0% |
| 5–9 | 346M | 327M | 4.2% | 4.0% |
| 0–4 | 329M | 314M | 4.0% | 3.8% |
| All ages | 4.16B | 4.11B | 50.3% | 49.7% |
In 2026, the largest age group in the world is 10–14, with 8.3% of the population. Children aged 0–14 make up 24.2% of the world's population and people aged 65 and over 10.5%. Among people aged 65 and over, there are 80.1 men per 100 women. In 1950, the largest group was 0–4 (13.6%); children made up 34.7% of the population and people aged 65 and over 5.1%.
A population pyramid, also called an age-sex pyramid, shows the number of men and of women in each five-year age group, the youngest at the bottom: men on one side, women on the other. The figures are the United Nations' estimates (World Population Prospects); the years after 2024 are the UN's projections.
Population pyramids of the regions (2026)
- Men Women
Africa
Asia
Europe
Latin America
North America
Oceania
In 2026, the share of children aged 0–14 ranges from 38.6% in Africa to 15.0% in Europe, and the share of people aged 65 and over from 21.2% in Europe to 3.7% in Africa. Africa's largest age group is 0–4; Europe's is 40–44.
Age structure by country (2026)
| Country | Aged 0–14 | Aged 15–64 | Aged 65+ |
|---|---|---|---|
 World |
24.2% | 65.2% | 10.5% |
 Afghanistan |
42.4% | 55.2% | 2.4% |
 Albania |
16.5% | 65.5% | 18.0% |
 Algeria |
29.7% | 63.4% | 6.9% |
 Andorra |
11.5% | 71.6% | 16.9% |
 Angola |
44.0% | 53.1% | 2.9% |
 Antigua |
17.3% | 70.0% | 12.6% |
 Argentina |
20.7% | 66.5% | 12.7% |
 Armenia |
18.9% | 66.3% | 14.8% |
 Australia |
17.6% | 64.1% | 18.3% |
 Austria |
14.1% | 64.6% | 21.3% |
 Azerbaijan |
20.9% | 69.6% | 9.5% |
 Bahamas |
17.4% | 70.3% | 12.3% |
 Bahrain |
18.3% | 77.6% | 4.1% |
 Bangladesh |
27.5% | 65.8% | 6.8% |
 Barbados |
17.0% | 65.6% | 17.4% |
 Belarus |
15.7% | 65.7% | 18.6% |
 Belgium |
15.6% | 63.3% | 21.2% |
 Belize |
26.2% | 68.5% | 5.3% |
 Benin |
41.1% | 55.7% | 3.2% |
 Bhutan |
20.1% | 73.2% | 6.7% |
 Bolivia |
29.3% | 64.9% | 5.8% |
 Bosnia |
12.8% | 64.1% | 23.2% |
 Botswana |
31.9% | 64.0% | 4.1% |
 Brazil |
19.2% | 69.1% | 11.7% |
 Brunei |
20.5% | 72.0% | 7.4% |
 Bulgaria |
14.4% | 63.3% | 22.3% |
 Burkina Faso |
40.9% | 56.4% | 2.7% |
 Burundi |
43.6% | 53.8% | 2.6% |
 Cambodia |
29.4% | 64.2% | 6.5% |
 Cameroon |
41.0% | 56.2% | 2.8% |
 Canada |
14.9% | 64.6% | 20.5% |
 Cape Verde |
24.3% | 68.4% | 7.3% |
 Cayman Islands |
16.0% | 74.2% | 9.8% |
 CAR |
48.5% | 49.3% | 2.2% |
 Chad |
46.0% | 51.9% | 2.1% |
 Chile |
16.3% | 68.8% | 14.8% |
 China |
15.1% | 69.9% | 15.0% |
 Colombia |
19.9% | 69.7% | 10.4% |
 Comoros |
36.7% | 58.8% | 4.4% |
 Congo |
39.7% | 57.2% | 3.1% |
 Costa Rica |
18.1% | 68.9% | 13.0% |
 Croatia |
13.6% | 62.6% | 23.8% |
 Cuba |
14.9% | 67.8% | 17.3% |
 Curacao |
14.4% | 68.0% | 17.6% |
 Cyprus |
16.1% | 68.8% | 15.1% |
 Czech Republic |
14.9% | 63.7% | 21.4% |
 Denmark |
15.5% | 63.2% | 21.3% |
 Djibouti |
28.6% | 66.3% | 5.0% |
 Dominica |
17.5% | 69.2% | 13.3% |
 Dominican Republic |
26.0% | 65.7% | 8.3% |
 DR Congo |
45.9% | 51.0% | 3.1% |
 East Timor |
32.9% | 61.9% | 5.2% |
 Ecuador |
23.6% | 67.6% | 8.7% |
 Egypt |
31.3% | 63.3% | 5.3% |
 El Salvador |
24.2% | 67.4% | 8.4% |
 Equatorial Guinea |
37.0% | 59.2% | 3.8% |
 Eritrea |
37.3% | 58.4% | 4.3% |
 Estonia |
15.0% | 62.9% | 22.1% |
 Eswatini |
32.8% | 62.8% | 4.4% |
 Ethiopia |
38.6% | 58.0% | 3.3% |
 Fiji |
26.7% | 66.6% | 6.7% |
 Finland |
14.2% | 61.5% | 24.4% |
 France |
16.1% | 61.2% | 22.7% |
 Gabon |
36.1% | 59.7% | 4.2% |
 Gambia |
39.5% | 57.3% | 3.2% |
 Georgia |
20.3% | 63.5% | 16.2% |
 Germany |
13.9% | 62.1% | 24.0% |
 Ghana |
35.2% | 60.9% | 3.8% |
 Greece |
12.7% | 62.7% | 24.6% |
 Grenada |
18.8% | 68.4% | 12.8% |
 Guatemala |
30.8% | 64.2% | 5.0% |
 Guinea |
40.4% | 56.1% | 3.5% |
 Guinea-Bissau |
38.1% | 58.6% | 3.3% |
 Guyana |
28.8% | 64.1% | 7.1% |
 Haiti |
30.6% | 64.6% | 4.8% |
 Honduras |
30.1% | 65.3% | 4.6% |
 Hungary |
14.3% | 64.4% | 21.3% |
 Iceland |
17.4% | 66.5% | 16.1% |
 India |
24.0% | 68.5% | 7.5% |
 Indonesia |
24.1% | 68.3% | 7.7% |
 Iran |
21.8% | 69.4% | 8.8% |
 Iraq |
35.7% | 60.8% | 3.5% |
 Ireland |
17.9% | 65.8% | 16.4% |
 Israel |
27.0% | 60.2% | 12.8% |
 Italy |
11.5% | 63.1% | 25.4% |
 Ivory Coast |
40.2% | 57.1% | 2.7% |
 Jamaica |
18.1% | 73.1% | 8.8% |
 Japan |
11.1% | 58.8% | 30.1% |
 Jordan |
30.0% | 65.2% | 4.9% |
 Kazakhstan |
29.0% | 61.8% | 9.2% |
 Kenya |
36.0% | 61.0% | 3.0% |
 Kiribati |
34.2% | 61.4% | 4.5% |
 Kuwait |
17.9% | 78.9% | 3.2% |
 Kyrgyzstan |
31.7% | 62.2% | 6.1% |
 Laos |
29.7% | 65.5% | 4.9% |
 Latvia |
15.1% | 62.5% | 22.4% |
 Lebanon |
25.3% | 64.1% | 10.6% |
 Lesotho |
33.9% | 62.2% | 3.9% |
 Liberia |
38.9% | 57.8% | 3.4% |
 Libya |
26.5% | 68.2% | 5.3% |
 Liechtenstein |
14.3% | 64.0% | 21.7% |
 Lithuania |
14.4% | 64.6% | 21.1% |
 Luxembourg |
15.7% | 68.3% | 16.0% |
 Madagascar |
38.8% | 57.7% | 3.5% |
 Malawi |
39.9% | 57.6% | 2.6% |
 Malaysia |
21.1% | 70.7% | 8.2% |
 Maldives |
18.7% | 76.1% | 5.1% |
 Mali |
45.6% | 52.0% | 2.4% |
 Malta |
12.8% | 66.4% | 20.7% |
 Marshall Islands |
33.6% | 61.4% | 5.0% |
 Mauritania |
42.2% | 54.5% | 3.3% |
 Mauritius |
14.4% | 71.2% | 14.4% |
 Mexico |
23.9% | 67.5% | 8.7% |
 Moldova |
19.4% | 63.4% | 17.2% |
 Monaco |
13.9% | 50.1% | 35.9% |
 Mongolia |
31.2% | 63.2% | 5.6% |
 Montenegro |
17.7% | 63.7% | 18.6% |
 Morocco |
25.0% | 66.4% | 8.6% |
 Mozambique |
44.0% | 53.3% | 2.7% |
 Myanmar |
24.0% | 68.4% | 7.6% |
 Namibia |
36.5% | 59.7% | 3.9% |
 Nauru |
36.8% | 60.1% | 3.1% |
 Nepal |
27.9% | 65.5% | 6.7% |
 Netherlands |
14.9% | 64.1% | 21.1% |
 New Zealand |
17.8% | 64.4% | 17.8% |
 Nicaragua |
28.1% | 66.1% | 5.8% |
 Niger |
46.0% | 51.3% | 2.6% |
 Nigeria |
40.3% | 56.6% | 3.1% |
 North Korea |
18.9% | 68.2% | 12.9% |
 North Macedonia |
16.4% | 64.9% | 18.8% |
 Norway |
15.8% | 65.0% | 19.2% |
 Oman |
24.2% | 73.1% | 2.7% |
 Pakistan |
36.0% | 59.6% | 4.4% |
 Palau |
17.8% | 70.1% | 12.1% |
 Palestine |
37.3% | 58.8% | 3.9% |
 Panama |
24.3% | 65.8% | 9.8% |
 Papua New Guinea |
33.0% | 63.4% | 3.7% |
 Paraguay |
28.3% | 64.9% | 6.8% |
 Peru |
23.4% | 67.0% | 9.6% |
 Philippines |
26.8% | 67.4% | 5.8% |
 Poland |
14.3% | 64.7% | 21.1% |
 Portugal |
12.7% | 62.2% | 25.2% |
 Qatar |
15.0% | 83.3% | 1.7% |
 Romania |
15.5% | 64.3% | 20.2% |
 Russia |
16.9% | 65.0% | 18.1% |
 Rwanda |
36.9% | 59.1% | 4.1% |
 Saint Kitts |
18.5% | 69.5% | 12.0% |
 Saint Lucia |
17.1% | 72.7% | 10.1% |
 Saint Vincent |
20.7% | 66.9% | 12.4% |
 Samoa |
37.8% | 56.0% | 6.2% |
 San Marino |
11.6% | 64.9% | 23.5% |
 Sao Tome |
37.3% | 58.7% | 4.0% |
 Saudi Arabia |
23.5% | 73.4% | 3.1% |
 Senegal |
37.5% | 58.8% | 3.7% |
 Serbia |
14.2% | 62.5% | 23.2% |
 Seychelles |
19.7% | 71.5% | 8.9% |
 Sierra Leone |
37.4% | 59.3% | 3.3% |
 Singapore |
11.7% | 73.8% | 14.5% |
 Slovakia |
15.5% | 65.2% | 19.3% |
 Slovenia |
14.4% | 63.2% | 22.4% |
 Solomon Islands |
36.3% | 60.0% | 3.7% |
 Somalia |
46.6% | 50.8% | 2.6% |
 South Africa |
25.6% | 67.4% | 7.0% |
 South Korea |
10.0% | 69.1% | 20.9% |
 South Sudan |
37.5% | 59.3% | 3.1% |
 Spain |
12.5% | 65.6% | 21.9% |
 Sri Lanka |
21.5% | 65.8% | 12.7% |
 Sudan |
40.0% | 56.6% | 3.4% |
 Suriname |
25.2% | 66.5% | 8.3% |
 Sweden |
16.6% | 62.4% | 21.0% |
 Switzerland |
14.8% | 64.5% | 20.6% |
 Syria |
28.1% | 67.0% | 4.9% |
 Taiwan |
11.4% | 68.1% | 20.5% |
 Tajikistan |
35.6% | 60.2% | 4.2% |
 Tanzania |
42.2% | 54.7% | 3.0% |
 Thailand |
14.2% | 69.4% | 16.3% |
 Togo |
39.0% | 57.7% | 3.3% |
 Tonga |
34.6% | 58.4% | 6.9% |
 Trinidad |
17.4% | 69.4% | 13.2% |
 Tunisia |
23.3% | 66.5% | 10.1% |
 Turkey |
20.8% | 68.5% | 10.7% |
 Turkmenistan |
31.0% | 64.0% | 4.9% |
 Tuvalu |
33.0% | 59.7% | 7.3% |
 Uganda |
42.9% | 54.9% | 2.2% |
 Ukraine |
13.6% | 67.5% | 18.9% |
 UAE |
15.9% | 82.3% | 1.8% |
 United Kingdom |
16.8% | 63.3% | 19.8% |
 United States |
17.0% | 64.4% | 18.6% |
 Uruguay |
17.7% | 65.9% | 16.4% |
 Uzbekistan |
31.4% | 62.4% | 6.2% |
 Vanuatu |
37.8% | 57.8% | 4.4% |
 Venezuela |
24.6% | 65.2% | 10.2% |
 Vietnam |
22.7% | 67.6% | 9.7% |
 Yemen |
41.0% | 56.5% | 2.6% |
 Zambia |
40.7% | 57.2% | 2.0% |
 Zimbabwe |
40.0% | 56.5% | 3.5% |
In 2026, children aged 0–14 outnumber people aged 65 and over in 143 of the 196 countries, and people aged 65 and over outnumber children in 53. The share of children is highest in the Central African Republic, at 48.5%, and the share of people aged 65 and over in Monaco, at 35.9%.
Compare the population pyramids of any 2 countries
Sources:
- United Nations | World Population Prospects (2024–2026, updated October 2026), with adjustments by statistics.wiki to match the latest data
Creative Commons Attribution (CC BY): you may copy, share, adapt and reuse this content, also commercially, as long as you credit statistics.wiki and note any changes you made. The sources listed above may have their own license terms.