
List of countries by population aged 65 and over (2026)
| Rank | Country | Aged 65+ | People aged 65+ | Aged 80+ | Aged 65+, 2050 projection |
|---|---|---|---|---|---|
 World |
10.5% | 869M | 2.1% | 16.2% | |
| 1 |  Monaco |
35.9% | 13.7K | 16.1% | 29.0% |
| 2 |  Japan |
30.1% | 36.9M | 10.7% | 37.4% |
| 3 |  Italy |
25.4% | 14.9M | 8.0% | 36.8% |
| 4 |  Portugal |
25.2% | 2.71M | 7.4% | 33.1% |
| 5 |  Greece |
24.6% | 2.55M | 7.7% | 34.6% |
| 6 |  Finland |
24.4% | 1.38M | 6.5% | 28.2% |
| 7 |  Germany |
24.0% | 19.9M | 7.4% | 30.3% |
| 8 |  Croatia |
23.8% | 917K | 5.6% | 30.6% |
| 9 |  San Marino |
23.5% | 8.02K | 7.0% | 36.9% |
| 10 |  Serbia |
23.2% | 1.51M | 4.7% | 29.0% |
| 11 |  Bosnia |
23.2% | 722K | 5.2% | 33.8% |
| 12 |  France |
22.7% | 15.7M | 6.4% | 27.6% |
| 13 |  Latvia |
22.4% | 410K | 6.1% | 28.8% |
| 14 |  Slovenia |
22.4% | 478K | 5.6% | 31.7% |
| 15 |  Bulgaria |
22.3% | 1.43M | 5.1% | 29.3% |
| 16 |  Estonia |
22.1% | 297K | 6.1% | 29.6% |
| 17 |  Spain |
21.9% | 10.8M | 6.6% | 36.0% |
| 18 |  Liechtenstein |
21.7% | 8.96K | 5.5% | 29.9% |
| 19 |  Czech Republic |
21.4% | 2.29M | 5.1% | 29.5% |
| 20 |  Austria |
21.3% | 1.96M | 6.3% | 30.7% |
| 21 |  Denmark |
21.3% | 1.28M | 6.0% | 25.6% |
| 22 |  Hungary |
21.3% | 2.01M | 5.1% | 27.3% |
| 23 |  Belgium |
21.2% | 2.53M | 5.8% | 27.7% |
| 24 |  Poland |
21.1% | 7.58M | 4.4% | 31.5% |
| 25 |  Netherlands |
21.1% | 3.83M | 5.2% | 26.2% |
| 26 |  Lithuania |
21.1% | 599K | 5.7% | 28.5% |
| 27 |  Sweden |
21.0% | 2.23M | 6.4% | 25.6% |
| 28 |  South Korea |
20.9% | 10.8M | 5.0% | 39.5% |
| 29 |  Malta |
20.7% | 121K | 5.3% | 30.3% |
| 30 |  Switzerland |
20.6% | 1.89M | 6.1% | 30.1% |
| 31 |  Taiwan |
20.5% | 4.76M | 4.1% | 38.5% |
| 32 |  Canada |
20.5% | 8.61M | 5.1% | 25.6% |
| 33 |  Romania |
20.2% | 3.82M | 4.4% | 27.7% |
| 34 |  United Kingdom |
19.8% | 13.8M | 5.5% | 24.6% |
| 35 |  Slovakia |
19.3% | 1.04M | 3.9% | 29.8% |
| 36 |  Norway |
19.2% | 1.09M | 5.0% | 26.7% |
| 37 |  Ukraine |
18.9% | 7.63M | 4.2% | 28.7% |
| 38 |  North Macedonia |
18.8% | 340K | 3.4% | 27.4% |
| 39 |  United States |
18.6% | 64M | 4.3% | 23.0% |
| 40 |  Belarus |
18.6% | 1.68M | 3.3% | 27.2% |
| 41 |  Montenegro |
18.6% | 114K | 3.8% | 26.5% |
| 42 |  Australia |
18.3% | 5.1M | 4.8% | 23.7% |
| 43 |  Russia |
18.1% | 25.9M | 3.3% | 23.6% |
| 44 |  Albania |
18.0% | 419K | 3.9% | 27.7% |
| 45 |  New Zealand |
17.8% | 955K | 4.3% | 23.9% |
| 46 |  Curacao |
17.6% | 27.4K | 3.3% | 23.8% |
| 47 |  Barbados |
17.4% | 49.1K | 3.1% | 24.3% |
| 48 |  Cuba |
17.3% | 1.88M | 4.3% | 30.0% |
| 49 |  Moldova |
17.2% | 400K | 2.4% | 21.4% |
| 50 |  Andorra |
16.9% | 14.2K | 4.0% | 36.4% |
| 51 |  Uruguay |
16.4% | 555K | 4.8% | 23.4% |
| 52 |  Ireland |
16.4% | 907K | 4.0% | 26.0% |
| 53 |  Thailand |
16.3% | 11.7M | 3.4% | 29.4% |
| 54 |  Georgia |
16.2% | 636K | 3.2% | 20.7% |
| 55 |  Iceland |
16.1% | 64.1K | 3.8% | 23.8% |
| 56 |  Luxembourg |
16.0% | 111K | 4.0% | 25.8% |
| 57 |  Cyprus |
15.1% | 209K | 3.6% | 26.1% |
| 58 |  China |
15.0% | 211M | 2.7% | 30.6% |
| 59 |  Chile |
14.8% | 2.96M | 3.4% | 26.4% |
| 60 |  Armenia |
14.8% | 454K | 2.2% | 23.7% |
| 61 |  Singapore |
14.5% | 891K | 2.8% | 26.4% |
| 62 |  Mauritius |
14.4% | 179K | 2.3% | 26.0% |
| 63 |  Dominica |
13.3% | 8.73K | 2.5% | 18.4% |
| 64 |  Trinidad |
13.2% | 181K | 1.7% | 23.5% |
| 65 |  Costa Rica |
13.0% | 674K | 2.8% | 25.0% |
| 66 |  North Korea |
12.9% | 3.43M | 2.6% | 21.3% |
| 67 |  Grenada |
12.8% | 15.1K | 3.0% | 19.9% |
| 68 |  Israel |
12.8% | 1.31M | 3.0% | 15.7% |
| 69 |  Argentina |
12.7% | 5.86M | 3.0% | 19.8% |
| 70 |  Sri Lanka |
12.7% | 2.77M | 2.1% | 20.2% |
| 71 |  Antigua |
12.6% | 11.9K | 2.2% | 24.2% |
| 72 |  Saint Vincent |
12.4% | 12.4K | 2.2% | 19.1% |
| 73 |  Bahamas |
12.3% | 49.6K | 3.0% | 21.0% |
| 74 |  Palau |
12.1% | 2.13K | 1.4% | 20.3% |
| 75 |  Saint Kitts |
12.0% | 5.62K | 1.6% | 20.3% |
| 76 |  Brazil |
11.7% | 25M | 2.1% | 22.3% |
| 77 |  Turkey |
10.7% | 9.23M | 1.9% | 21.9% |
| 78 |  Lebanon |
10.6% | 625K | 1.9% | 16.3% |
| 79 |  Colombia |
10.4% | 5.62M | 1.7% | 20.4% |
| 80 |  Venezuela |
10.2% | 2.92M | 1.7% | 16.3% |
| 81 |  Tunisia |
10.1% | 1.26M | 1.4% | 20.2% |
| 82 |  Saint Lucia |
10.1% | 18.3K | 1.6% | 20.2% |
| 83 |  Panama |
9.8% | 454K | 2.1% | 18.3% |
| 84 |  Cayman Islands |
9.8% | 7.56K | 1.7% | 25.1% |
| 85 |  Vietnam |
9.7% | 9.93M | 1.5% | 19.7% |
| 86 |  Peru |
9.6% | 3.35M | 2.1% | 17.5% |
| 87 |  Azerbaijan |
9.5% | 978K | 1.0% | 17.9% |
| 88 |  Kazakhstan |
9.2% | 1.94M | 1.2% | 13.7% |
| 89 |  Seychelles |
8.9% | 11.1K | 1.4% | 18.7% |
| 90 |  Jamaica |
8.8% | 249K | 1.3% | 19.1% |
| 91 |  Iran |
8.8% | 8.16M | 1.3% | 22.0% |
| 92 |  Ecuador |
8.7% | 1.61M | 1.7% | 17.0% |
| 93 |  Mexico |
8.7% | 11.5M | 1.6% | 16.8% |
| 94 |  Morocco |
8.6% | 3.34M | 1.1% | 16.2% |
| 95 |  El Salvador |
8.4% | 536K | 1.6% | 14.5% |
| 96 |  Suriname |
8.3% | 53.8K | 1.5% | 14.8% |
| 97 |  Dominican Republic |
8.3% | 969K | 1.4% | 14.9% |
| 98 |  Malaysia |
8.2% | 2.98M | 1.3% | 16.5% |
| 99 |  Indonesia |
7.7% | 22.1M | 1.1% | 15.0% |
| 100 |  Myanmar |
7.6% | 4.21M | 0.9% | 13.4% |
| 101 |  India |
7.5% | 111M | 1.1% | 14.5% |
| 102 |  Brunei |
7.4% | 34.9K | 0.9% | 19.1% |
| 103 |  Cape Verde |
7.3% | 38.7K | 1.2% | 16.2% |
| 104 |  Tuvalu |
7.3% | 680 | 1.1% | 8.7% |
| 105 |  Guyana |
7.1% | 59.7K | 1.1% | 11.1% |
| 106 |  South Africa |
7.0% | 4.57M | 1.2% | 11.1% |
| 107 |  Tonga |
6.9% | 7.16K | 1.3% | 10.6% |
| 108 |  Algeria |
6.9% | 3.32M | 1.0% | 16.0% |
| 109 |  Paraguay |
6.8% | 483K | 1.2% | 12.2% |
| 110 |  Bangladesh |
6.8% | 12M | 1.2% | 13.3% |
| 111 |  Fiji |
6.7% | 62.9K | 0.8% | 10.5% |
| 112 |  Bhutan |
6.7% | 53.7K | 1.1% | 15.6% |
| 113 |  Nepal |
6.7% | 1.98M | 0.9% | 10.9% |
| 114 |  Cambodia |
6.5% | 1.17M | 0.8% | 11.4% |
| 115 |  Uzbekistan |
6.2% | 2.33M | 0.8% | 10.2% |
| 116 |  Samoa |
6.2% | 13.6K | 0.9% | 8.1% |
| 117 |  Kyrgyzstan |
6.1% | 456K | 0.6% | 10.0% |
| 118 |  Philippines |
5.8% | 6.87M | 0.6% | 11.0% |
| 119 |  Bolivia |
5.8% | 738K | 1.0% | 9.7% |
| 120 |  Nicaragua |
5.8% | 410K | 0.9% | 12.6% |
| 121 |  Mongolia |
5.6% | 202K | 0.8% | 12.4% |
| 122 |  Egypt |
5.3% | 6.43M | 0.5% | 9.6% |
| 123 |  Belize |
5.3% | 22.9K | 0.7% | 12.7% |
| 124 |  Libya |
5.3% | 399K | 0.9% | 15.7% |
| 125 |  East Timor |
5.2% | 74.8K | 0.9% | 6.9% |
| 126 |  Maldives |
5.1% | 27.2K | 0.9% | 20.8% |
| 127 |  Djibouti |
5.0% | 60.4K | 0.7% | 9.8% |
| 128 |  Guatemala |
5.0% | 952K | 0.8% | 9.5% |
| 129 |  Marshall Islands |
5.0% | 1.75K | 0.4% | 12.8% |
| 130 |  Turkmenistan |
4.9% | 383K | 0.5% | 10.7% |
| 131 |  Syria |
4.9% | 1.3M | 0.6% | 9.2% |
| 132 |  Laos |
4.9% | 389K | 0.6% | 9.7% |
| 133 |  Jordan |
4.9% | 557K | 0.7% | 11.9% |
| 134 |  Haiti |
4.8% | 582K | 0.6% | 8.3% |
| 135 |  Honduras |
4.6% | 515K | 0.6% | 10.0% |
| 136 |  Kiribati |
4.5% | 6.16K | 0.5% | 7.3% |
| 137 |  Comoros |
4.4% | 40K | 0.7% | 6.5% |
| 138 |  Vanuatu |
4.4% | 15.1K | 0.5% | 6.7% |
| 139 |  Pakistan |
4.4% | 11.4M | 0.6% | 6.3% |
| 140 |  Eswatini |
4.4% | 55.6K | 0.6% | 7.3% |
| 141 |  Eritrea |
4.3% | 158K | 0.7% | 5.8% |
| 142 |  Tajikistan |
4.2% | 459K | 0.4% | 7.7% |
| 143 |  Gabon |
4.2% | 110K | 0.6% | 7.1% |
| 144 |  Botswana |
4.1% | 107K | 0.6% | 7.6% |
| 145 |  Bahrain |
4.1% | 67K | 0.6% | 8.4% |
| 146 |  Rwanda |
4.1% | 606K | 0.5% | 6.1% |
| 147 |  Sao Tome |
4.0% | 9.73K | 0.7% | 6.6% |
| 148 |  Lesotho |
3.9% | 93K | 0.6% | 5.8% |
| 149 |  Palestine |
3.9% | 214K | 0.5% | 7.8% |
| 150 |  Namibia |
3.9% | 122K | 0.6% | 6.9% |
| 151 |  Ghana |
3.8% | 1.37M | 0.5% | 7.3% |
| 152 |  Equatorial Guinea |
3.8% | 75.5K | 0.4% | 6.1% |
| 153 |  Solomon Islands |
3.7% | 31.7K | 0.5% | 7.0% |
| 154 |  Senegal |
3.7% | 709K | 0.4% | 5.9% |
| 155 |  Papua New Guinea |
3.7% | 400K | 0.4% | 7.3% |
| 156 |  Zimbabwe |
3.5% | 611K | 0.5% | 5.2% |
| 157 |  Madagascar |
3.5% | 1.18M | 0.4% | 5.3% |
| 158 |  Guinea |
3.5% | 538K | 0.5% | 4.6% |
| 159 |  Iraq |
3.5% | 1.66M | 0.5% | 7.3% |
| 160 |  Sudan |
3.4% | 1.83M | 0.4% | 5.2% |
| 161 |  Liberia |
3.4% | 196K | 0.4% | 4.9% |
| 162 |  Ethiopia |
3.3% | 4.63M | 0.4% | 5.3% |
| 163 |  Sierra Leone |
3.3% | 297K | 0.4% | 5.4% |
| 164 |  Togo |
3.3% | 289K | 0.3% | 5.2% |
| 165 |  Guinea-Bissau |
3.3% | 74.9K | 0.4% | 5.6% |
| 166 |  Mauritania |
3.3% | 178K | 0.4% | 4.6% |
| 167 |  Gambia |
3.2% | 93.5K | 0.4% | 5.3% |
| 168 |  Kuwait |
3.2% | 159K | 0.3% | 6.6% |
| 169 |  Benin |
3.2% | 481K | 0.4% | 4.7% |
| 170 |  South Sudan |
3.1% | 388K | 0.3% | 5.9% |
| 171 |  Saudi Arabia |
3.1% | 1.17M | 0.5% | 8.0% |
| 172 |  Nauru |
3.1% | 375 | 0.1% | 6.1% |
| 173 |  Congo |
3.1% | 206K | 0.3% | 5.4% |
| 174 |  DR Congo |
3.1% | 3.6M | 0.4% | 3.5% |
| 175 |  Nigeria |
3.1% | 7.47M | 0.3% | 4.5% |
| 176 |  Kenya |
3.0% | 1.79M | 0.5% | 5.6% |
| 177 |  Tanzania |
3.0% | 2.21M | 0.5% | 4.4% |
| 178 |  Angola |
2.9% | 1.17M | 0.3% | 4.0% |
| 179 |  Cameroon |
2.8% | 867K | 0.3% | 4.7% |
| 180 |  Oman |
2.7% | 155K | 0.5% | 6.4% |
| 181 |  Mozambique |
2.7% | 998K | 0.3% | 3.5% |
| 182 |  Burkina Faso |
2.7% | 665K | 0.3% | 4.6% |
| 183 |  Ivory Coast |
2.7% | 897K | 0.3% | 4.7% |
| 184 |  Niger |
2.6% | 758K | 0.3% | 3.5% |
| 185 |  Somalia |
2.6% | 534K | 0.3% | 3.5% |
| 186 |  Malawi |
2.6% | 591K | 0.5% | 4.8% |
| 187 |  Yemen |
2.6% | 1.1M | 0.4% | 5.1% |
| 188 |  Burundi |
2.6% | 376K | 0.3% | 4.5% |
| 189 |  Afghanistan |
2.4% | 1.1M | 0.3% | 4.0% |
| 190 |  Mali |
2.4% | 610K | 0.3% | 3.4% |
| 191 |  Uganda |
2.2% | 1.19M | 0.3% | 4.2% |
| 192 |  CAR |
2.2% | 127K | 0.2% | 2.0% |
| 193 |  Chad |
2.1% | 458K | 0.2% | 3.2% |
| 194 |  Zambia |
2.0% | 457K | 0.2% | 4.7% |
| 195 |  UAE |
1.8% | 213K | 0.2% | 2.1% |
| 196 |  Qatar |
1.7% | 52.1K | 0.2% | 2.9% |
In 2026, people aged 65 and over make up 10.5% of the world's population: 869 million people. Across the 196 countries, the share ranges from 35.9% in Monaco to 1.7% in Qatar. By 2050, it is projected to rise in 194 of them and to fall in two.
The population aged 65 and over is the number of people who have reached 65; its share is that number divided by the whole population. The figures are the United Nations' estimates (World Population Prospects); the years after 2024 are the UN's projections.
Population aged 65 and over map, 1960–2026
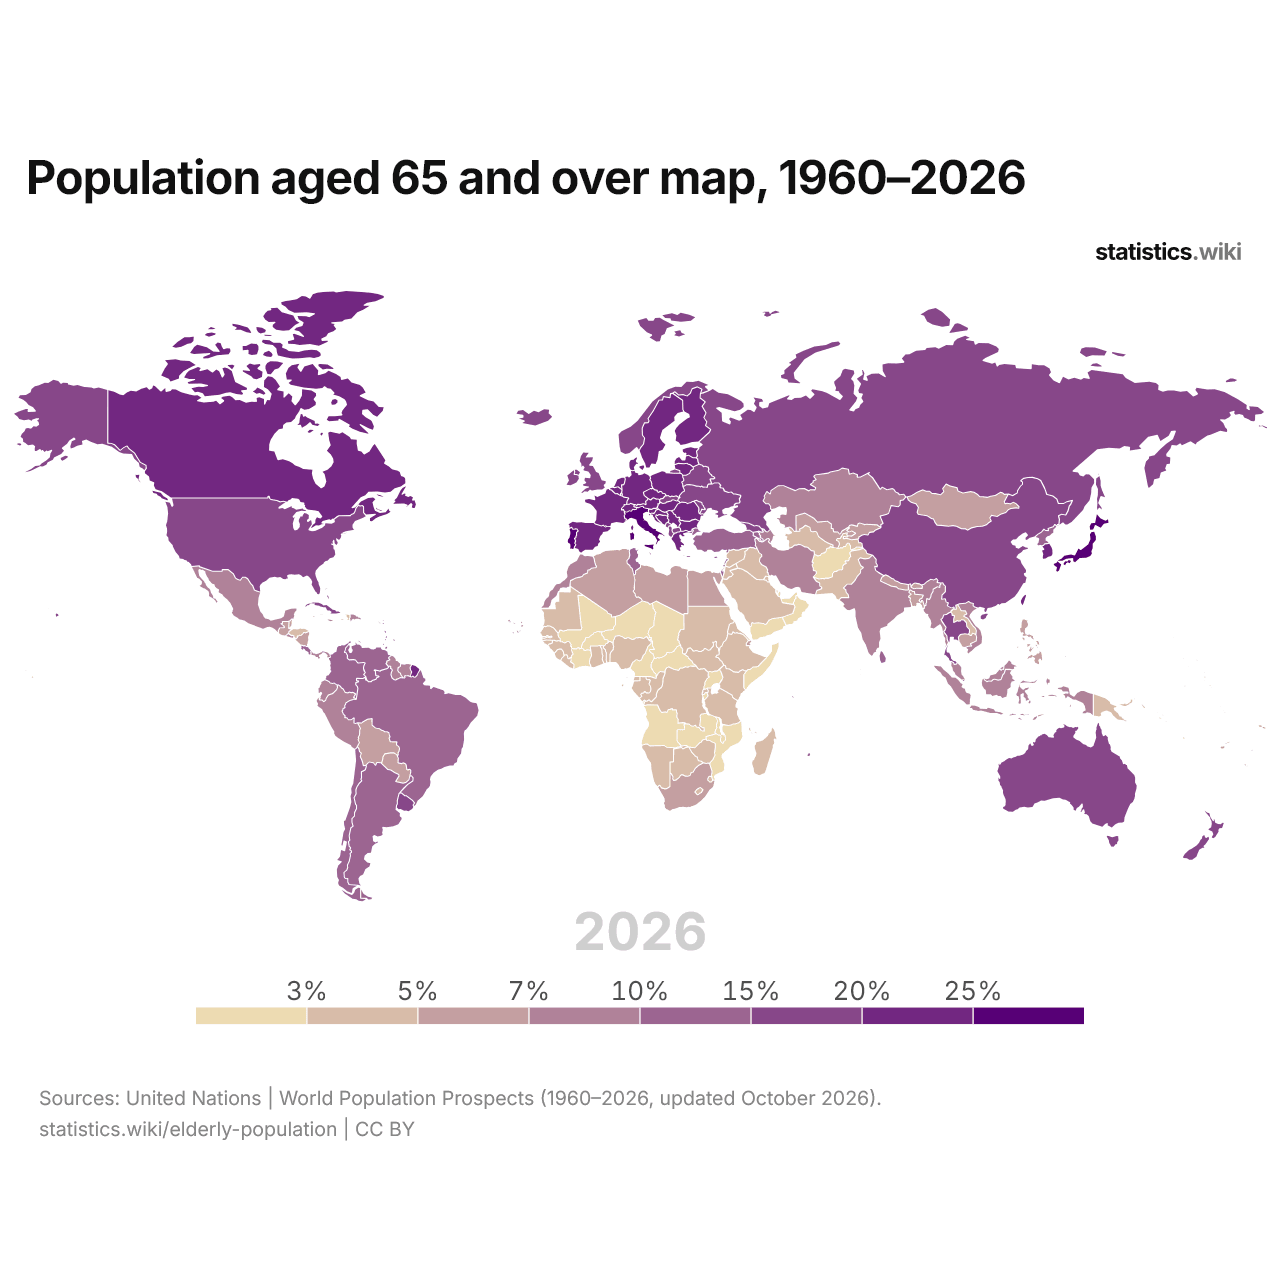
In 2026, people aged 65 and over make up more than 20% of the population in 34 countries and less than 5% in 68; in 1960, the numbers were 0 and 131.
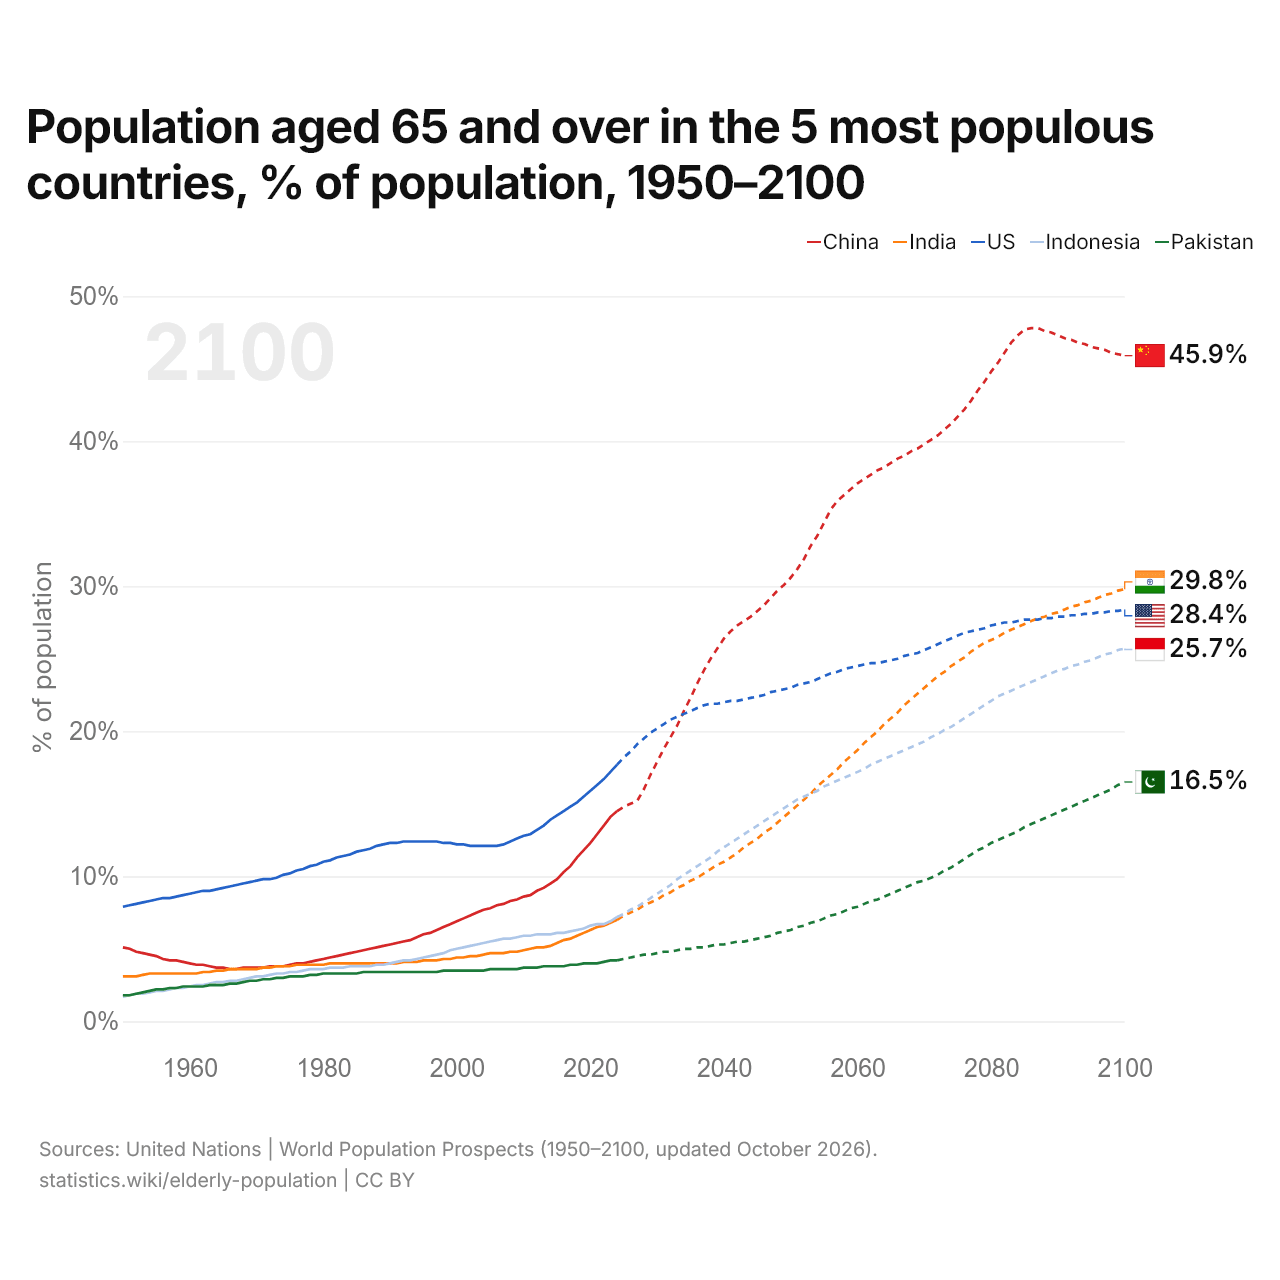
Population aged 65 and over in the 5 most populous countries, % of population, 1950–2100
| Year | % of population | ||||
|---|---|---|---|---|---|
| China | India | United States | Indonesia | Pakistan | |
| 2100 projected | 45.9% | 29.8% | 28.4% | 25.7% | 16.5% |
| 2099 projected | 46% | 29.7% | 28.3% | 25.6% | 16.3% |
| 2098 projected | 46.1% | 29.5% | 28.3% | 25.4% | 16% |
| 2097 projected | 46.3% | 29.4% | 28.2% | 25.3% | 15.8% |
| 2096 projected | 46.4% | 29.2% | 28.2% | 25.1% | 15.6% |
| 2095 projected | 46.5% | 29% | 28.1% | 24.9% | 15.4% |
| 2094 projected | 46.7% | 28.9% | 28.1% | 24.8% | 15.2% |
| 2093 projected | 46.8% | 28.7% | 28% | 24.6% | 15% |
| 2092 projected | 47% | 28.6% | 28% | 24.5% | 14.8% |
| 2091 projected | 47.1% | 28.4% | 27.9% | 24.3% | 14.6% |
| 2090 projected | 47.3% | 28.2% | 27.9% | 24.2% | 14.4% |
| 2089 projected | 47.5% | 28.1% | 27.8% | 24% | 14.2% |
| 2088 projected | 47.6% | 27.9% | 27.8% | 23.8% | 14% |
| 2087 projected | 47.8% | 27.8% | 27.7% | 23.6% | 13.8% |
| 2086 projected | 47.8% | 27.6% | 27.7% | 23.4% | 13.6% |
| 2085 projected | 47.7% | 27.4% | 27.7% | 23.2% | 13.4% |
| 2084 projected | 47.3% | 27.2% | 27.6% | 23% | 13.1% |
| 2083 projected | 46.8% | 27% | 27.5% | 22.8% | 12.9% |
| 2082 projected | 46.1% | 26.8% | 27.5% | 22.6% | 12.7% |
| 2081 projected | 45.4% | 26.5% | 27.4% | 22.4% | 12.5% |
| 2080 projected | 44.8% | 26.3% | 27.3% | 22.1% | 12.3% |
| 2079 projected | 44.1% | 26.1% | 27.1% | 21.8% | 12% |
| 2078 projected | 43.5% | 25.8% | 27% | 21.5% | 11.8% |
| 2077 projected | 42.8% | 25.5% | 26.9% | 21.2% | 11.5% |
| 2076 projected | 42.2% | 25.1% | 26.8% | 20.9% | 11.2% |
| 2075 projected | 41.7% | 24.8% | 26.6% | 20.6% | 10.9% |
| 2074 projected | 41.2% | 24.5% | 26.4% | 20.3% | 10.6% |
| 2073 projected | 40.8% | 24.1% | 26.2% | 20.1% | 10.4% |
| 2072 projected | 40.4% | 23.8% | 26% | 19.8% | 10.1% |
| 2071 projected | 40.1% | 23.4% | 25.8% | 19.6% | 9.9% |
| 2070 projected | 39.8% | 23% | 25.6% | 19.3% | 9.7% |
| 2069 projected | 39.5% | 22.6% | 25.4% | 19.1% | 9.6% |
| 2068 projected | 39.3% | 22.2% | 25.3% | 18.9% | 9.4% |
| 2067 projected | 39% | 21.8% | 25.2% | 18.7% | 9.2% |
| 2066 projected | 38.8% | 21.3% | 25% | 18.5% | 9% |
| 2065 projected | 38.5% | 20.9% | 24.9% | 18.3% | 8.8% |
| 2064 projected | 38.2% | 20.5% | 24.8% | 18.1% | 8.6% |
| 2063 projected | 38% | 20% | 24.7% | 17.9% | 8.4% |
| 2062 projected | 37.7% | 19.6% | 24.7% | 17.7% | 8.3% |
| 2061 projected | 37.4% | 19.2% | 24.6% | 17.4% | 8.1% |
| 2060 projected | 37.1% | 18.7% | 24.5% | 17.2% | 7.9% |
| 2059 projected | 36.7% | 18.3% | 24.4% | 17% | 7.8% |
| 2058 projected | 36.3% | 17.9% | 24.3% | 16.8% | 7.6% |
| 2057 projected | 35.9% | 17.4% | 24.1% | 16.6% | 7.4% |
| 2056 projected | 35.3% | 17% | 24% | 16.4% | 7.3% |
| 2055 projected | 34.4% | 16.6% | 23.8% | 16.2% | 7.1% |
| 2054 projected | 33.5% | 16.2% | 23.6% | 15.9% | 6.9% |
| 2053 projected | 32.8% | 15.7% | 23.4% | 15.7% | 6.8% |
| 2052 projected | 31.9% | 15.3% | 23.3% | 15.5% | 6.6% |
| 2051 projected | 31.2% | 14.9% | 23.2% | 15.3% | 6.5% |
| 2050 projected | 30.6% | 14.5% | 23% | 15% | 6.3% |
| 2049 projected | 30.1% | 14.1% | 22.9% | 14.7% | 6.2% |
| 2048 projected | 29.7% | 13.7% | 22.8% | 14.4% | 6.1% |
| 2047 projected | 29.2% | 13.3% | 22.7% | 14.1% | 5.9% |
| 2046 projected | 28.7% | 13% | 22.5% | 13.8% | 5.8% |
| 2045 projected | 28.3% | 12.6% | 22.4% | 13.5% | 5.7% |
| 2044 projected | 27.9% | 12.3% | 22.3% | 13.2% | 5.6% |
| 2043 projected | 27.6% | 12% | 22.2% | 12.9% | 5.5% |
| 2042 projected | 27.3% | 11.6% | 22.1% | 12.6% | 5.5% |
| 2041 projected | 26.9% | 11.3% | 22.1% | 12.3% | 5.4% |
| 2040 projected | 26.4% | 11% | 22% | 12% | 5.3% |
| 2039 projected | 25.7% | 10.8% | 21.9% | 11.7% | 5.3% |
| 2038 projected | 25% | 10.5% | 21.9% | 11.3% | 5.2% |
| 2037 projected | 24.2% | 10.2% | 21.8% | 11% | 5.1% |
| 2036 projected | 23.3% | 9.9% | 21.6% | 10.7% | 5.1% |
| 2035 projected | 22.3% | 9.7% | 21.4% | 10.4% | 5% |
| 2034 projected | 21.4% | 9.4% | 21.2% | 10.1% | 5% |
| 2033 projected | 20.4% | 9.2% | 21% | 9.8% | 4.9% |
| 2032 projected | 19.6% | 8.9% | 20.8% | 9.4% | 4.8% |
| 2031 projected | 18.8% | 8.7% | 20.5% | 9.1% | 4.8% |
| 2030 projected | 17.9% | 8.4% | 20.2% | 8.8% | 4.7% |
| 2029 projected | 17% | 8.2% | 19.9% | 8.5% | 4.6% |
| 2028 projected | 16% | 8% | 19.5% | 8.2% | 4.6% |
| 2027 projected | 15.2% | 7.7% | 19.1% | 7.9% | 4.5% |
| 2026 projected | 15% | 7.5% | 18.6% | 7.7% | 4.4% |
| 2025 projected | 14.8% | 7.3% | 18.2% | 7.4% | 4.3% |
| 2024 | 14.5% | 7% | 17.7% | 7.2% | 4.2% |
| 2023 | 14.1% | 6.8% | 17.2% | 6.9% | 4.2% |
| 2022 | 13.5% | 6.6% | 16.7% | 6.7% | 4.1% |
| 2021 | 12.9% | 6.5% | 16.3% | 6.7% | 4% |
| 2020 | 12.3% | 6.3% | 15.9% | 6.6% | 4% |
| 2019 | 11.8% | 6.1% | 15.5% | 6.4% | 4% |
| 2018 | 11.3% | 5.9% | 15.1% | 6.3% | 3.9% |
| 2017 | 10.7% | 5.7% | 14.8% | 6.2% | 3.9% |
| 2016 | 10.3% | 5.6% | 14.5% | 6.1% | 3.8% |
| 2015 | 9.8% | 5.4% | 14.2% | 6.1% | 3.8% |
| 2014 | 9.5% | 5.2% | 13.9% | 6% | 3.8% |
| 2013 | 9.2% | 5.1% | 13.5% | 6% | 3.8% |
| 2012 | 9% | 5.1% | 13.2% | 6% | 3.7% |
| 2011 | 8.7% | 5% | 12.9% | 5.9% | 3.7% |
| 2010 | 8.6% | 4.9% | 12.8% | 5.9% | 3.7% |
| 2009 | 8.4% | 4.8% | 12.6% | 5.8% | 3.6% |
| 2008 | 8.3% | 4.8% | 12.4% | 5.7% | 3.6% |
| 2007 | 8.1% | 4.7% | 12.2% | 5.7% | 3.6% |
| 2006 | 8% | 4.7% | 12.1% | 5.6% | 3.6% |
| 2005 | 7.8% | 4.7% | 12.1% | 5.5% | 3.6% |
| 2004 | 7.7% | 4.6% | 12.1% | 5.4% | 3.5% |
| 2003 | 7.5% | 4.5% | 12.1% | 5.3% | 3.5% |
| 2002 | 7.3% | 4.5% | 12.1% | 5.2% | 3.5% |
| 2001 | 7.1% | 4.4% | 12.2% | 5.1% | 3.5% |
| 2000 | 6.9% | 4.4% | 12.2% | 5% | 3.5% |
| 1999 | 6.7% | 4.3% | 12.3% | 4.9% | 3.5% |
| 1998 | 6.5% | 4.3% | 12.3% | 4.7% | 3.5% |
| 1997 | 6.3% | 4.2% | 12.4% | 4.6% | 3.4% |
| 1996 | 6.1% | 4.2% | 12.4% | 4.5% | 3.4% |
| 1995 | 6% | 4.2% | 12.4% | 4.4% | 3.4% |
| 1994 | 5.8% | 4.1% | 12.4% | 4.3% | 3.4% |
| 1993 | 5.6% | 4.1% | 12.4% | 4.2% | 3.4% |
| 1992 | 5.5% | 4.1% | 12.4% | 4.2% | 3.4% |
| 1991 | 5.4% | 4% | 12.3% | 4.1% | 3.4% |
| 1990 | 5.3% | 4% | 12.3% | 4% | 3.4% |
| 1989 | 5.2% | 4% | 12.2% | 3.9% | 3.4% |
| 1988 | 5.1% | 4% | 12.1% | 3.9% | 3.4% |
| 1987 | 5% | 4% | 11.9% | 3.8% | 3.4% |
| 1986 | 4.9% | 4% | 11.8% | 3.8% | 3.4% |
| 1985 | 4.8% | 4% | 11.7% | 3.8% | 3.3% |
| 1984 | 4.7% | 4% | 11.5% | 3.8% | 3.3% |
| 1983 | 4.6% | 4% | 11.4% | 3.7% | 3.3% |
| 1982 | 4.5% | 4% | 11.3% | 3.7% | 3.3% |
| 1981 | 4.4% | 4% | 11.1% | 3.7% | 3.3% |
| 1980 | 4.3% | 3.9% | 11% | 3.6% | 3.3% |
| 1979 | 4.2% | 3.9% | 10.8% | 3.6% | 3.2% |
| 1978 | 4.1% | 3.9% | 10.7% | 3.6% | 3.2% |
| 1977 | 4% | 3.9% | 10.5% | 3.5% | 3.1% |
| 1976 | 4% | 3.9% | 10.4% | 3.4% | 3.1% |
| 1975 | 3.9% | 3.8% | 10.2% | 3.4% | 3.1% |
| 1974 | 3.8% | 3.8% | 10.1% | 3.3% | 3% |
| 1973 | 3.8% | 3.8% | 9.9% | 3.3% | 3% |
| 1972 | 3.8% | 3.7% | 9.8% | 3.2% | 2.9% |
| 1971 | 3.7% | 3.7% | 9.8% | 3.1% | 2.9% |
| 1970 | 3.7% | 3.6% | 9.7% | 3.1% | 2.8% |
| 1969 | 3.7% | 3.6% | 9.6% | 3% | 2.8% |
| 1968 | 3.7% | 3.6% | 9.5% | 2.9% | 2.7% |
| 1967 | 3.6% | 3.6% | 9.4% | 2.8% | 2.6% |
| 1966 | 3.6% | 3.6% | 9.3% | 2.8% | 2.6% |
| 1965 | 3.7% | 3.5% | 9.2% | 2.7% | 2.5% |
| 1964 | 3.7% | 3.5% | 9.1% | 2.7% | 2.5% |
| 1963 | 3.8% | 3.4% | 9% | 2.6% | 2.5% |
| 1962 | 3.9% | 3.4% | 9% | 2.5% | 2.4% |
| 1961 | 3.9% | 3.3% | 8.9% | 2.5% | 2.4% |
| 1960 | 4% | 3.3% | 8.8% | 2.4% | 2.4% |
| 1959 | 4.1% | 3.3% | 8.7% | 2.3% | 2.4% |
| 1958 | 4.2% | 3.3% | 8.6% | 2.3% | 2.3% |
| 1957 | 4.2% | 3.3% | 8.5% | 2.2% | 2.3% |
| 1956 | 4.3% | 3.3% | 8.5% | 2.1% | 2.2% |
| 1955 | 4.5% | 3.3% | 8.4% | 2.1% | 2.2% |
| 1954 | 4.6% | 3.3% | 8.3% | 2% | 2.1% |
| 1953 | 4.7% | 3.2% | 8.2% | 1.9% | 2% |
| 1952 | 4.8% | 3.1% | 8.1% | 1.9% | 1.9% |
| 1951 | 5% | 3.1% | 8% | 1.8% | 1.8% |
| 1950 | 5.1% | 3.1% | 7.9% | 1.7% | 1.8% |
In 2026, among the five most populous countries, the share of people aged 65 and over is highest in the United States, at 18.6%, and lowest in Pakistan, at 4.4%. The gap between the highest and the lowest has widened from 6.2 percentage points in 1950 to 14.2.
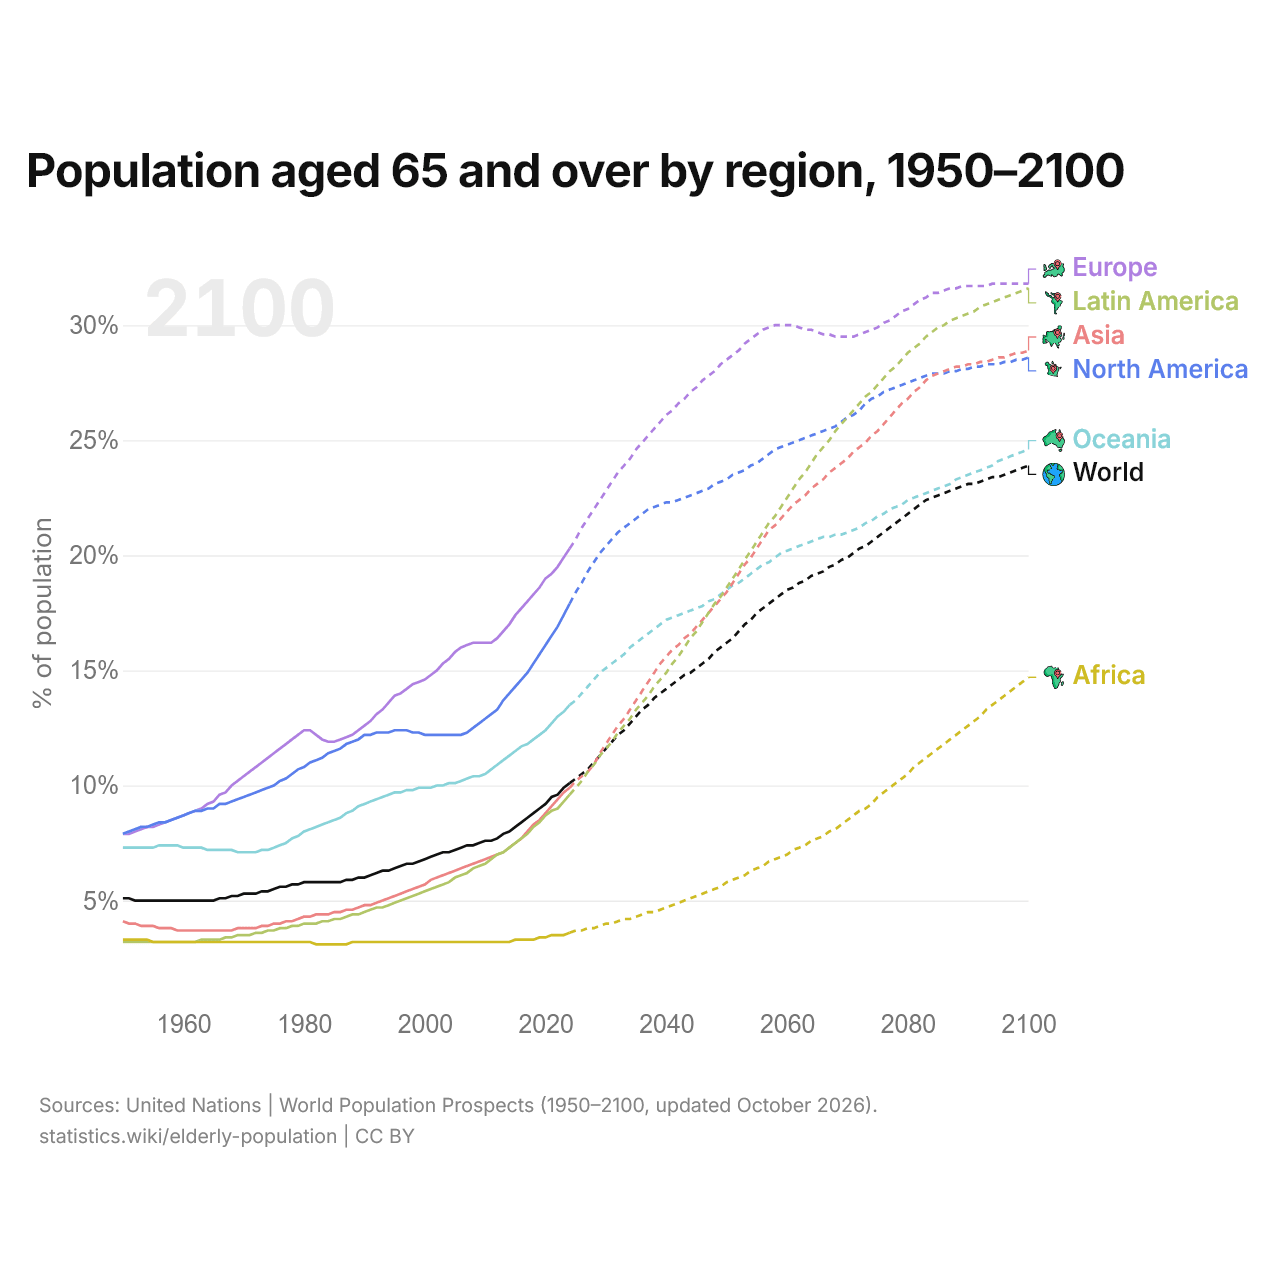
Population aged 65 and over by region, 1950–2100
| Year | % of population | ||||||
|---|---|---|---|---|---|---|---|
| Europe | North America | Oceania | World | Asia | Latin America | Africa | |
| 2100 projected | 31.8% | 28.6% | 24.6% | 23.9% | 28.9% | 31.6% | 14.7% |
| 2099 projected | 31.8% | 28.5% | 24.5% | 23.8% | 28.8% | 31.5% | 14.5% |
| 2098 projected | 31.8% | 28.5% | 24.4% | 23.7% | 28.8% | 31.4% | 14.3% |
| 2097 projected | 31.8% | 28.4% | 24.3% | 23.6% | 28.7% | 31.3% | 14.1% |
| 2096 projected | 31.8% | 28.4% | 24.2% | 23.5% | 28.6% | 31.2% | 13.9% |
| 2095 projected | 31.8% | 28.3% | 24.1% | 23.4% | 28.6% | 31.1% | 13.7% |
| 2094 projected | 31.8% | 28.3% | 23.9% | 23.4% | 28.5% | 31% | 13.5% |
| 2093 projected | 31.7% | 28.3% | 23.8% | 23.3% | 28.4% | 30.9% | 13.3% |
| 2092 projected | 31.7% | 28.2% | 23.7% | 23.2% | 28.4% | 30.8% | 13% |
| 2091 projected | 31.7% | 28.2% | 23.6% | 23.1% | 28.3% | 30.6% | 12.8% |
| 2090 projected | 31.7% | 28.1% | 23.5% | 23.1% | 28.3% | 30.5% | 12.6% |
| 2089 projected | 31.7% | 28.1% | 23.4% | 23% | 28.2% | 30.4% | 12.4% |
| 2088 projected | 31.6% | 28% | 23.3% | 22.9% | 28.2% | 30.3% | 12.2% |
| 2087 projected | 31.6% | 28% | 23.1% | 22.8% | 28.1% | 30.2% | 12% |
| 2086 projected | 31.5% | 27.9% | 23% | 22.7% | 28% | 30% | 11.8% |
| 2085 projected | 31.4% | 27.9% | 22.9% | 22.6% | 27.9% | 29.9% | 11.6% |
| 2084 projected | 31.4% | 27.9% | 22.8% | 22.5% | 27.8% | 29.7% | 11.4% |
| 2083 projected | 31.2% | 27.8% | 22.7% | 22.4% | 27.6% | 29.5% | 11.2% |
| 2082 projected | 31.1% | 27.7% | 22.6% | 22.2% | 27.3% | 29.2% | 11% |
| 2081 projected | 30.9% | 27.6% | 22.5% | 22% | 27.1% | 29% | 10.8% |
| 2080 projected | 30.7% | 27.5% | 22.4% | 21.8% | 26.8% | 28.8% | 10.5% |
| 2079 projected | 30.6% | 27.4% | 22.2% | 21.6% | 26.6% | 28.5% | 10.3% |
| 2078 projected | 30.4% | 27.3% | 22.1% | 21.4% | 26.3% | 28.2% | 10.1% |
| 2077 projected | 30.2% | 27.2% | 22% | 21.2% | 26% | 28% | 9.9% |
| 2076 projected | 30.1% | 27.1% | 21.8% | 21% | 25.7% | 27.7% | 9.7% |
| 2075 projected | 29.9% | 26.9% | 21.7% | 20.8% | 25.4% | 27.4% | 9.5% |
| 2074 projected | 29.8% | 26.8% | 21.5% | 20.6% | 25.2% | 27.1% | 9.2% |
| 2073 projected | 29.7% | 26.6% | 21.4% | 20.4% | 24.9% | 26.9% | 9% |
| 2072 projected | 29.6% | 26.3% | 21.2% | 20.3% | 24.7% | 26.6% | 8.9% |
| 2071 projected | 29.5% | 26.1% | 21.1% | 20.1% | 24.5% | 26.3% | 8.7% |
| 2070 projected | 29.5% | 26% | 21% | 19.9% | 24.2% | 26% | 8.5% |
| 2069 projected | 29.5% | 25.8% | 20.9% | 19.8% | 24% | 25.7% | 8.3% |
| 2068 projected | 29.5% | 25.6% | 20.9% | 19.6% | 23.8% | 25.4% | 8.1% |
| 2067 projected | 29.6% | 25.5% | 20.8% | 19.5% | 23.6% | 25% | 8% |
| 2066 projected | 29.6% | 25.4% | 20.8% | 19.3% | 23.3% | 24.7% | 7.8% |
| 2065 projected | 29.7% | 25.3% | 20.7% | 19.2% | 23.1% | 24.4% | 7.7% |
| 2064 projected | 29.8% | 25.2% | 20.6% | 19.1% | 22.9% | 24% | 7.6% |
| 2063 projected | 29.8% | 25.1% | 20.5% | 18.9% | 22.6% | 23.6% | 7.4% |
| 2062 projected | 29.9% | 25% | 20.4% | 18.8% | 22.4% | 23.3% | 7.3% |
| 2061 projected | 30% | 24.9% | 20.3% | 18.6% | 22.2% | 22.9% | 7.2% |
| 2060 projected | 30% | 24.8% | 20.2% | 18.5% | 21.9% | 22.5% | 7% |
| 2059 projected | 30% | 24.7% | 20.1% | 18.3% | 21.6% | 22.1% | 6.9% |
| 2058 projected | 30% | 24.6% | 19.9% | 18.1% | 21.3% | 21.7% | 6.8% |
| 2057 projected | 29.9% | 24.4% | 19.7% | 17.9% | 21.1% | 21.4% | 6.7% |
| 2056 projected | 29.8% | 24.2% | 19.6% | 17.7% | 20.7% | 21% | 6.5% |
| 2055 projected | 29.6% | 24% | 19.4% | 17.5% | 20.3% | 20.6% | 6.4% |
| 2054 projected | 29.4% | 23.9% | 19.2% | 17.2% | 19.9% | 20.2% | 6.3% |
| 2053 projected | 29.2% | 23.7% | 19% | 17% | 19.6% | 19.8% | 6.1% |
| 2052 projected | 28.9% | 23.6% | 18.8% | 16.7% | 19.2% | 19.4% | 6% |
| 2051 projected | 28.7% | 23.5% | 18.7% | 16.4% | 18.8% | 19% | 5.9% |
| 2050 projected | 28.5% | 23.3% | 18.5% | 16.2% | 18.4% | 18.6% | 5.8% |
| 2049 projected | 28.3% | 23.2% | 18.3% | 16% | 18.1% | 18.2% | 5.6% |
| 2048 projected | 28% | 23.1% | 18.1% | 15.8% | 17.8% | 17.9% | 5.5% |
| 2047 projected | 27.8% | 22.9% | 18% | 15.5% | 17.5% | 17.5% | 5.4% |
| 2046 projected | 27.6% | 22.8% | 17.8% | 15.3% | 17.2% | 17.1% | 5.3% |
| 2045 projected | 27.3% | 22.7% | 17.7% | 15.1% | 16.9% | 16.7% | 5.2% |
| 2044 projected | 27.1% | 22.6% | 17.6% | 14.9% | 16.6% | 16.4% | 5.1% |
| 2043 projected | 26.8% | 22.5% | 17.5% | 14.8% | 16.4% | 16% | 5% |
| 2042 projected | 26.6% | 22.4% | 17.4% | 14.6% | 16.1% | 15.6% | 4.9% |
| 2041 projected | 26.3% | 22.3% | 17.3% | 14.4% | 15.9% | 15.3% | 4.8% |
| 2040 projected | 26.1% | 22.3% | 17.2% | 14.2% | 15.6% | 14.9% | 4.7% |
| 2039 projected | 25.8% | 22.2% | 17% | 14% | 15.3% | 14.6% | 4.6% |
| 2038 projected | 25.5% | 22.1% | 16.8% | 13.8% | 14.9% | 14.3% | 4.5% |
| 2037 projected | 25.2% | 22% | 16.6% | 13.5% | 14.5% | 13.9% | 4.5% |
| 2036 projected | 24.9% | 21.8% | 16.4% | 13.3% | 14.1% | 13.6% | 4.4% |
| 2035 projected | 24.6% | 21.6% | 16.2% | 13% | 13.7% | 13.3% | 4.3% |
| 2034 projected | 24.2% | 21.4% | 16% | 12.7% | 13.3% | 12.9% | 4.2% |
| 2033 projected | 23.9% | 21.2% | 15.7% | 12.4% | 12.9% | 12.6% | 4.2% |
| 2032 projected | 23.6% | 21% | 15.5% | 12.2% | 12.6% | 12.3% | 4.1% |
| 2031 projected | 23.2% | 20.7% | 15.3% | 11.9% | 12.2% | 11.9% | 4% |
| 2030 projected | 22.8% | 20.4% | 15.1% | 11.6% | 11.8% | 11.6% | 4% |
| 2029 projected | 22.4% | 20.1% | 14.9% | 11.3% | 11.4% | 11.3% | 3.9% |
| 2028 projected | 22% | 19.7% | 14.6% | 11% | 10.9% | 10.9% | 3.8% |
| 2027 projected | 21.6% | 19.3% | 14.3% | 10.7% | 10.6% | 10.6% | 3.8% |
| 2026 projected | 21.2% | 18.8% | 14% | 10.5% | 10.4% | 10.2% | 3.7% |
| 2025 projected | 20.7% | 18.4% | 13.7% | 10.3% | 10.2% | 9.9% | 3.7% |
| 2024 | 20.3% | 17.9% | 13.5% | 10.1% | 9.9% | 9.6% | 3.6% |
| 2023 | 19.9% | 17.4% | 13.2% | 9.9% | 9.7% | 9.3% | 3.5% |
| 2022 | 19.5% | 16.9% | 13% | 9.6% | 9.4% | 9% | 3.5% |
| 2021 | 19.2% | 16.5% | 12.7% | 9.5% | 9.1% | 8.9% | 3.5% |
| 2020 | 19% | 16.1% | 12.4% | 9.2% | 8.8% | 8.7% | 3.4% |
| 2019 | 18.6% | 15.7% | 12.2% | 9% | 8.5% | 8.4% | 3.4% |
| 2018 | 18.3% | 15.3% | 12% | 8.8% | 8.3% | 8.2% | 3.3% |
| 2017 | 18% | 14.9% | 11.8% | 8.6% | 8% | 7.9% | 3.3% |
| 2016 | 17.7% | 14.6% | 11.7% | 8.4% | 7.7% | 7.7% | 3.3% |
| 2015 | 17.4% | 14.3% | 11.5% | 8.2% | 7.5% | 7.5% | 3.3% |
| 2014 | 17% | 14% | 11.3% | 8% | 7.3% | 7.3% | 3.2% |
| 2013 | 16.7% | 13.7% | 11.1% | 7.9% | 7.1% | 7.1% | 3.2% |
| 2012 | 16.4% | 13.3% | 10.9% | 7.7% | 7% | 7% | 3.2% |
| 2011 | 16.2% | 13.1% | 10.7% | 7.6% | 6.9% | 6.8% | 3.2% |
| 2010 | 16.2% | 12.9% | 10.5% | 7.6% | 6.8% | 6.6% | 3.2% |
| 2009 | 16.2% | 12.7% | 10.4% | 7.5% | 6.7% | 6.5% | 3.2% |
| 2008 | 16.2% | 12.5% | 10.4% | 7.4% | 6.6% | 6.4% | 3.2% |
| 2007 | 16.1% | 12.3% | 10.3% | 7.4% | 6.5% | 6.2% | 3.2% |
| 2006 | 16% | 12.2% | 10.2% | 7.3% | 6.4% | 6.1% | 3.2% |
| 2005 | 15.8% | 12.2% | 10.1% | 7.2% | 6.3% | 6% | 3.2% |
| 2004 | 15.5% | 12.2% | 10.1% | 7.1% | 6.2% | 5.8% | 3.2% |
| 2003 | 15.3% | 12.2% | 10% | 7.1% | 6.1% | 5.7% | 3.2% |
| 2002 | 15% | 12.2% | 10% | 7% | 6% | 5.6% | 3.2% |
| 2001 | 14.8% | 12.2% | 9.9% | 6.9% | 5.9% | 5.5% | 3.2% |
| 2000 | 14.6% | 12.2% | 9.9% | 6.8% | 5.7% | 5.4% | 3.2% |
| 1999 | 14.5% | 12.3% | 9.9% | 6.7% | 5.6% | 5.3% | 3.2% |
| 1998 | 14.4% | 12.3% | 9.8% | 6.6% | 5.5% | 5.2% | 3.2% |
| 1997 | 14.2% | 12.4% | 9.8% | 6.6% | 5.4% | 5.1% | 3.2% |
| 1996 | 14% | 12.4% | 9.7% | 6.5% | 5.3% | 5% | 3.2% |
| 1995 | 13.9% | 12.4% | 9.7% | 6.4% | 5.2% | 4.9% | 3.2% |
| 1994 | 13.6% | 12.3% | 9.6% | 6.3% | 5.1% | 4.8% | 3.2% |
| 1993 | 13.3% | 12.3% | 9.5% | 6.3% | 5% | 4.7% | 3.2% |
| 1992 | 13.1% | 12.3% | 9.4% | 6.2% | 4.9% | 4.7% | 3.2% |
| 1991 | 12.8% | 12.2% | 9.3% | 6.1% | 4.8% | 4.6% | 3.2% |
| 1990 | 12.6% | 12.2% | 9.2% | 6% | 4.8% | 4.5% | 3.2% |
| 1989 | 12.4% | 12% | 9.1% | 6% | 4.7% | 4.4% | 3.2% |
| 1988 | 12.2% | 11.9% | 8.9% | 5.9% | 4.6% | 4.4% | 3.2% |
| 1987 | 12.1% | 11.8% | 8.8% | 5.9% | 4.6% | 4.3% | 3.1% |
| 1986 | 12% | 11.6% | 8.6% | 5.8% | 4.5% | 4.2% | 3.1% |
| 1985 | 11.9% | 11.5% | 8.5% | 5.8% | 4.5% | 4.2% | 3.1% |
| 1984 | 11.9% | 11.4% | 8.4% | 5.8% | 4.4% | 4.1% | 3.1% |
| 1983 | 12% | 11.2% | 8.3% | 5.8% | 4.4% | 4.1% | 3.1% |
| 1982 | 12.2% | 11.1% | 8.2% | 5.8% | 4.4% | 4% | 3.1% |
| 1981 | 12.4% | 11% | 8.1% | 5.8% | 4.3% | 4% | 3.2% |
| 1980 | 12.4% | 10.8% | 8% | 5.8% | 4.3% | 4% | 3.2% |
| 1979 | 12.2% | 10.7% | 7.8% | 5.7% | 4.2% | 3.9% | 3.2% |
| 1978 | 12% | 10.5% | 7.7% | 5.7% | 4.1% | 3.9% | 3.2% |
| 1977 | 11.8% | 10.3% | 7.5% | 5.6% | 4.1% | 3.8% | 3.2% |
| 1976 | 11.6% | 10.2% | 7.4% | 5.6% | 4% | 3.8% | 3.2% |
| 1975 | 11.4% | 10% | 7.3% | 5.5% | 4% | 3.7% | 3.2% |
| 1974 | 11.2% | 9.9% | 7.2% | 5.4% | 3.9% | 3.7% | 3.2% |
| 1973 | 11% | 9.8% | 7.2% | 5.4% | 3.9% | 3.6% | 3.2% |
| 1972 | 10.8% | 9.7% | 7.1% | 5.3% | 3.8% | 3.6% | 3.2% |
| 1971 | 10.6% | 9.6% | 7.1% | 5.3% | 3.8% | 3.5% | 3.2% |
| 1970 | 10.4% | 9.5% | 7.1% | 5.3% | 3.8% | 3.5% | 3.2% |
| 1969 | 10.2% | 9.4% | 7.1% | 5.2% | 3.8% | 3.5% | 3.2% |
| 1968 | 10% | 9.3% | 7.2% | 5.2% | 3.7% | 3.4% | 3.2% |
| 1967 | 9.7% | 9.2% | 7.2% | 5.1% | 3.7% | 3.4% | 3.2% |
| 1966 | 9.6% | 9.2% | 7.2% | 5.1% | 3.7% | 3.3% | 3.2% |
| 1965 | 9.3% | 9% | 7.2% | 5% | 3.7% | 3.3% | 3.2% |
| 1964 | 9.2% | 9% | 7.2% | 5% | 3.7% | 3.3% | 3.2% |
| 1963 | 9% | 8.9% | 7.3% | 5% | 3.7% | 3.3% | 3.2% |
| 1962 | 8.9% | 8.9% | 7.3% | 5% | 3.7% | 3.2% | 3.2% |
| 1961 | 8.8% | 8.8% | 7.3% | 5% | 3.7% | 3.2% | 3.2% |
| 1960 | 8.7% | 8.7% | 7.3% | 5% | 3.7% | 3.2% | 3.2% |
| 1959 | 8.6% | 8.6% | 7.4% | 5% | 3.7% | 3.2% | 3.2% |
| 1958 | 8.5% | 8.5% | 7.4% | 5% | 3.8% | 3.2% | 3.2% |
| 1957 | 8.4% | 8.4% | 7.4% | 5% | 3.8% | 3.2% | 3.2% |
| 1956 | 8.3% | 8.4% | 7.4% | 5% | 3.8% | 3.2% | 3.2% |
| 1955 | 8.2% | 8.3% | 7.3% | 5% | 3.9% | 3.2% | 3.2% |
| 1954 | 8.2% | 8.2% | 7.3% | 5% | 3.9% | 3.2% | 3.3% |
| 1953 | 8.1% | 8.2% | 7.3% | 5% | 3.9% | 3.2% | 3.3% |
| 1952 | 8% | 8.1% | 7.3% | 5% | 4% | 3.2% | 3.3% |
| 1951 | 7.9% | 8% | 7.3% | 5.1% | 4% | 3.2% | 3.3% |
| 1950 | 7.9% | 7.9% | 7.3% | 5.1% | 4.1% | 3.2% | 3.3% |
In 2026, the share of people aged 65 and over is highest in Europe, at 21.2%, and lowest in Africa, at 3.7%. In 1950, they made up 5.1% of the world's population. Their share is projected to rise to 23.9% by 2100.
Compare the population aged 65 and over of any 2 countries
Sources:
- United Nations | World Population Prospects (1950–2100, updated October 2026), with adjustments by statistics.wiki to match the latest data
Creative Commons Attribution (CC BY): you may copy, share, adapt and reuse this content, also commercially, as long as you credit statistics.wiki and note any changes you made. The sources listed above may have their own license terms.