
List of countries by life expectancy (2026)
| Rank | Country | Life expectancy | Men | Women | Difference between women and men | Change since 2000 |
|---|---|---|---|---|---|---|
 World |
73.8 | 71.2 | 76.4 | 5.3 | +7.3 | |
| 1 |  Monaco |
86.7 | 84.8 | 88.8 | 4.1 | +4.6 |
| 2 |  San Marino |
86.0 | 84.5 | 87.4 | 2.9 | +5.5 |
| 3 |  Japan |
85.1 | 82.1 | 88.2 | 6.1 | +4.0 |
| 4 |  South Korea |
84.6 | 81.6 | 87.5 | 6.0 | +8.4 |
| 5 |  Andorra |
84.5 | 82.6 | 86.5 | 3.9 | +2.6 |
| 6 |  Switzerland |
84.4 | 82.5 | 86.2 | 3.7 | +4.5 |
| 7 |  Australia |
84.3 | 82.6 | 86.1 | 3.5 | +4.7 |
| 8 |  Italy |
84.2 | 82.1 | 86.1 | 4.0 | +4.6 |
| 9 |  Singapore |
84.1 | 81.7 | 86.6 | 4.9 | +6.4 |
| 10 |  Spain |
84.1 | 81.4 | 86.7 | 5.3 | +4.7 |
| 11 |  Liechtenstein |
84.1 | 82.4 | 85.6 | 3.2 | +5.5 |
| 12 |  Malta |
83.8 | 81.9 | 85.6 | 3.8 | +5.9 |
| 13 |  Norway |
83.8 | 82.3 | 85.2 | 2.9 | +5.1 |
| 14 |  Sweden |
83.7 | 82.0 | 85.5 | 3.4 | +4.0 |
| 15 |  France |
83.7 | 80.9 | 86.4 | 5.6 | +4.7 |
| 16 |  Vatican |
83.4 | 81.3 | 85.4 | 4.1 | +4.1 |
| 17 |  UAE |
83.4 | 82.6 | 84.6 | 2.0 | +7.0 |
| 18 |  Iceland |
83.3 | 82.0 | 84.7 | 2.7 | +3.8 |
| 19 |  Canada |
83.1 | 80.9 | 85.2 | 4.2 | +3.8 |
| 20 |  Ireland |
82.9 | 81.0 | 84.9 | 3.9 | +6.4 |
| 21 |  Israel |
82.9 | 80.8 | 84.9 | 4.1 | +3.7 |
| 22 |  Portugal |
82.9 | 80.1 | 85.5 | 5.4 | +6.1 |
| 23 |  Qatar |
82.8 | 82.1 | 83.7 | 1.6 | +7.6 |
| 24 |  Luxembourg |
82.6 | 81.1 | 84.2 | 3.1 | +5.4 |
| 25 |  Netherlands |
82.6 | 81.1 | 84.1 | 3.0 | +4.5 |
| 26 |  Belgium |
82.6 | 80.5 | 84.7 | 4.2 | +4.8 |
| 27 |  New Zealand |
82.5 | 80.9 | 84.1 | 3.2 | +3.9 |
| 28 |  Austria |
82.5 | 80.2 | 84.7 | 4.5 | +4.2 |
| 29 |  Finland |
82.4 | 79.8 | 85.0 | 5.2 | +4.7 |
| 30 |  Greece |
82.4 | 79.9 | 84.7 | 4.8 | +4.0 |
| 31 |  Denmark |
82.4 | 80.6 | 84.2 | 3.6 | +5.6 |
| 32 |  Cyprus |
82.2 | 80.2 | 84.1 | 3.8 | +4.3 |
| 33 |  Slovenia |
82.1 | 79.5 | 84.7 | 5.2 | +6.3 |
| 34 |  Germany |
81.9 | 79.6 | 84.1 | 4.5 | +3.8 |
| 35 |  United Kingdom |
81.7 | 79.9 | 83.6 | 3.7 | +3.9 |
| 36 |  Bahrain |
81.7 | 81.2 | 82.4 | 1.2 | +7.1 |
| 37 |  Maldives |
81.7 | 80.4 | 83.3 | 2.9 | +10.8 |
| 38 |  Chile |
81.7 | 79.9 | 83.5 | 3.6 | +4.6 |
| 39 |  Costa Rica |
81.4 | 78.8 | 83.9 | 5.0 | +4.1 |
| 40 |  Taiwan |
81.1 | 78.3 | 84.0 | 5.7 | +5.0 |
| 41 |  Kuwait |
81.0 | 79.8 | 82.3 | 2.5 | +5.1 |
| 42 |  Cayman Islands |
80.9 | 78.6 | 83.3 | 4.7 | +6.5 |
| 43 |  Oman |
80.7 | 79.2 | 82.4 | 3.2 | +7.0 |
| 44 |  Czech Republic |
80.3 | 77.5 | 83.0 | 5.4 | +5.3 |
| 45 |  Panama |
80.1 | 77.3 | 83.0 | 5.7 | +6.7 |
| 46 |  Albania |
80.1 | 78.3 | 81.9 | 3.6 | +5.3 |
| 47 |  United States |
79.8 | 77.4 | 82.2 | 4.8 | +3.0 |
| 48 |  Estonia |
79.6 | 75.6 | 83.4 | 7.8 | +8.6 |
| 49 |  Saudi Arabia |
79.4 | 77.8 | 81.7 | 3.9 | +6.8 |
| 50 |  Poland |
79.2 | 75.5 | 82.7 | 7.2 | +5.5 |
| 51 |  Croatia |
79.1 | 76.0 | 82.1 | 6.1 | +5.1 |
| 52 |  China |
79.0 | 76.4 | 81.8 | 5.4 | +6.7 |
| 53 |  Slovakia |
78.8 | 75.6 | 82.0 | 6.4 | +5.7 |
| 54 |  Cuba |
78.6 | 76.3 | 81.0 | 4.7 | +2.7 |
| 55 |  Uruguay |
78.6 | 74.8 | 82.3 | 7.5 | +3.9 |
| 56 |  Bosnia |
78.4 | 75.1 | 81.4 | 6.3 | +3.1 |
| 57 |  Turkey |
78.4 | 75.5 | 81.3 | 5.8 | +6.4 |
| 58 |  Jordan |
78.3 | 76.2 | 80.6 | 4.4 | +6.4 |
| 59 |  Peru |
78.3 | 76.0 | 80.6 | 4.6 | +8.5 |
| 60 |  Colombia |
78.3 | 75.6 | 80.9 | 5.4 | +7.4 |
| 61 |  Iran |
78.2 | 76.4 | 80.2 | 3.7 | +8.1 |
| 62 |  Lebanon |
78.2 | 76.2 | 80.1 | 3.9 | +4.3 |
| 63 |  Antigua |
78.1 | 75.1 | 80.7 | 5.6 | +3.3 |
| 64 |  Sri Lanka |
78.0 | 74.9 | 81.0 | 6.2 | +6.9 |
| 65 |  Ecuador |
77.9 | 75.3 | 80.6 | 5.3 | +5.8 |
| 66 |  Argentina |
77.8 | 75.3 | 80.3 | 5.0 | +3.9 |
| 67 |  North Macedonia |
77.8 | 75.6 | 80.0 | 4.4 | +5.2 |
| 68 |  Montenegro |
77.6 | 74.3 | 80.7 | 6.4 | +4.1 |
| 69 |  Hungary |
77.5 | 74.3 | 80.6 | 6.3 | +5.7 |
| 70 |  Palestine |
77.4 | 75.0 | 79.8 | 4.8 | +7.1 |
| 71 |  Curacao |
77.3 | 73.1 | 81.2 | 8.2 | +4.1 |
| 72 |  Serbia |
77.3 | 74.1 | 80.5 | 6.4 | +5.0 |
| 73 |  Malaysia |
77.2 | 74.8 | 79.8 | 5.0 | +4.4 |
| 74 |  Tunisia |
77.1 | 74.6 | 79.7 | 5.1 | +4.5 |
| 75 |  Thailand |
77.1 | 72.9 | 81.4 | 8.4 | +5.9 |
| 76 |  Algeria |
76.9 | 75.5 | 78.3 | 2.8 | +6.3 |
| 77 |  Barbados |
76.6 | 74.1 | 79.0 | 5.0 | +2.1 |
| 78 |  Latvia |
76.6 | 72.1 | 80.9 | 8.7 | +6.5 |
| 79 |  Cape Verde |
76.6 | 73.4 | 79.7 | 6.2 | +8.4 |
| 80 |  Lithuania |
76.5 | 71.8 | 81.1 | 9.2 | +4.3 |
| 81 |  Romania |
76.4 | 72.9 | 79.9 | 7.0 | +5.2 |
| 82 |  Brazil |
76.4 | 73.3 | 79.5 | 6.1 | +6.8 |
| 83 |  Armenia |
76.2 | 72.0 | 79.9 | 7.9 | +5.4 |
| 84 |  Bulgaria |
76.1 | 72.7 | 79.7 | 7.0 | +4.6 |
| 85 |  Morocco |
75.9 | 73.7 | 78.1 | 4.4 | +9.1 |
| 86 |  Brunei |
75.8 | 73.8 | 78.1 | 4.3 | +1.8 |
| 87 |  Grenada |
75.7 | 72.8 | 78.8 | 5.9 | +2.7 |
| 88 |  Mexico |
75.6 | 72.8 | 78.4 | 5.5 | +3.1 |
| 89 |  Bangladesh |
75.5 | 73.8 | 77.2 | 3.4 | +13.4 |
| 90 |  Mauritius |
75.4 | 72.5 | 78.6 | 6.2 | +3.7 |
| 91 |  Nicaragua |
75.4 | 72.8 | 77.9 | 5.1 | +9.1 |
| 92 |  Libya |
75.2 | 72.7 | 77.8 | 5.1 | +4.6 |
| 93 |  Vietnam |
75.0 | 70.4 | 79.6 | 9.2 | +2.3 |
| 94 |  Ukraine |
75.0 | 70.2 | 79.7 | 9.5 | +7.2 |
| 95 |  Bahamas |
75.0 | 71.4 | 78.6 | 7.2 | +2.5 |
| 96 |  Georgia |
75.0 | 70.1 | 79.5 | 9.4 | +4.9 |
| 97 |  Belarus |
75.0 | 70.1 | 79.5 | 9.4 | +6.5 |
| 98 |  Azerbaijan |
74.9 | 72.0 | 77.6 | 5.6 | +9.5 |
| 99 |  Kazakhstan |
74.8 | 70.6 | 78.8 | 8.2 | +11.0 |
| 100 |  Paraguay |
74.2 | 71.3 | 77.4 | 6.1 | +4.2 |
| 101 |  Dominican Republic |
74.1 | 70.9 | 77.4 | 6.4 | +3.8 |
| 102 |  Belize |
74.1 | 71.4 | 77.0 | 5.6 | +5.2 |
| 103 |  Suriname |
74.0 | 70.9 | 77.3 | 6.4 | +9.6 |
| 104 |  North Korea |
74.0 | 71.8 | 76.2 | 4.4 | +13.1 |
| 105 |  Trinidad |
73.9 | 70.8 | 77.1 | 6.3 | +5.3 |
| 106 |  Bhutan |
73.8 | 72.1 | 75.8 | 3.8 | +12.0 |
| 107 |  Russia |
73.7 | 67.9 | 79.5 | 11.6 | +8.7 |
| 108 |  Syria |
73.4 | 71.0 | 75.9 | 5.0 | +2.6 |
| 109 |  Tonga |
73.4 | 69.8 | 76.8 | 7.0 | +3.8 |
| 110 |  Honduras |
73.4 | 70.8 | 76.0 | 5.2 | +5.1 |
| 111 |  Seychelles |
73.3 | 70.4 | 77.0 | 6.6 | +2.0 |
| 112 |  Saint Lucia |
73.2 | 69.7 | 76.7 | 7.0 | +2.4 |
| 113 |  Guatemala |
73.0 | 70.7 | 75.4 | 4.7 | +5.9 |
| 114 |  Venezuela |
73.0 | 69.2 | 77.0 | 7.8 | +0.6 |
| 115 |  Uzbekistan |
72.8 | 69.8 | 75.8 | 6.0 | +7.3 |
| 116 |  El Salvador |
72.7 | 68.2 | 76.9 | 8.7 | +5.0 |
| 117 |  India |
72.7 | 71.2 | 74.4 | 3.2 | +10.0 |
| 118 |  Iraq |
72.6 | 70.7 | 74.4 | 3.8 | +7.8 |
| 119 |  Saint Kitts |
72.6 | 69.0 | 76.4 | 7.5 | +3.3 |
| 120 |  Mongolia |
72.5 | 68.0 | 77.1 | 9.1 | +9.0 |
| 121 |  Tajikistan |
72.2 | 69.9 | 74.5 | 4.6 | +8.6 |
| 122 |  Egypt |
72.2 | 70.0 | 74.4 | 4.4 | +4.8 |
| 123 |  Kyrgyzstan |
72.1 | 68.6 | 75.7 | 7.1 | +6.9 |
| 124 |  Samoa |
72.1 | 70.2 | 74.1 | 4.0 | +1.3 |
| 125 |  Vanuatu |
72.0 | 69.9 | 74.5 | 4.6 | +3.4 |
| 126 |  Jamaica |
71.9 | 69.3 | 74.4 | 5.2 | +0.6 |
| 127 |  Saint Vincent |
71.7 | 69.0 | 74.8 | 5.8 | +1.3 |
| 128 |  Dominica |
71.6 | 68.6 | 75.1 | 6.4 | −0.1 |
| 129 |  Moldova |
71.6 | 67.0 | 75.9 | 9.0 | +4.1 |
| 130 |  Indonesia |
71.6 | 69.4 | 73.8 | 4.4 | +5.3 |
| 131 |  Nepal |
71.2 | 69.6 | 72.7 | 3.1 | +8.5 |
| 132 |  Cambodia |
71.1 | 68.4 | 73.7 | 5.3 | +11.6 |
| 133 |  Solomon Islands |
71.0 | 69.6 | 72.5 | 2.9 | +3.9 |
| 134 |  Guyana |
70.6 | 66.8 | 74.4 | 7.5 | +6.5 |
| 135 |  Turkmenistan |
70.5 | 67.2 | 73.3 | 6.1 | +5.5 |
| 136 |  Sao Tome |
70.3 | 66.7 | 74.3 | 7.5 | +9.1 |
| 137 |  Philippines |
70.2 | 67.2 | 73.2 | 6.0 | +2.4 |
| 138 |  Yemen |
69.7 | 67.6 | 71.9 | 4.2 | +7.0 |
| 139 |  Laos |
69.7 | 67.5 | 72.0 | 4.6 | +11.4 |
| 140 |  Palau |
69.6 | 67.4 | 72.2 | 4.8 | +5.1 |
| 141 |  Botswana |
69.6 | 67.0 | 72.2 | 5.1 | +17.3 |
| 142 |  Eritrea |
69.4 | 67.2 | 71.5 | 4.2 | +13.1 |
| 143 |  Senegal |
69.4 | 67.4 | 71.5 | 4.1 | +11.8 |
| 144 |  Mauritania |
69.2 | 67.1 | 71.2 | 4.1 | +8.1 |
| 145 |  Bolivia |
69.1 | 66.6 | 71.7 | 5.1 | +7.0 |
| 146 |  Uganda |
68.9 | 65.9 | 71.8 | 5.9 | +19.3 |
| 147 |  Gabon |
68.9 | 66.4 | 71.6 | 5.2 | +7.1 |
| 148 |  Rwanda |
68.5 | 66.1 | 70.6 | 4.5 | +20.7 |
| 149 |  East Timor |
68.3 | 66.7 | 70.1 | 3.5 | +10.2 |
| 150 |  Ethiopia |
68.1 | 64.9 | 71.6 | 6.7 | +17.3 |
| 151 |  Pakistan |
68.1 | 65.7 | 70.6 | 4.9 | +6.2 |
| 152 |  Malawi |
67.9 | 64.6 | 71.1 | 6.5 | +21.8 |
| 153 |  Namibia |
67.8 | 63.7 | 71.8 | 8.0 | +14.9 |
| 154 |  Fiji |
67.8 | 65.7 | 69.9 | 4.2 | +1.6 |
| 155 |  Tanzania |
67.6 | 64.8 | 70.4 | 5.7 | +14.4 |
| 156 |  Tuvalu |
67.6 | 64.2 | 71.2 | 7.0 | +4.0 |
| 157 |  Myanmar |
67.5 | 64.4 | 70.8 | 6.4 | +7.1 |
| 158 |  Comoros |
67.5 | 65.4 | 69.7 | 4.3 | +8.5 |
| 159 |  Marshall Islands |
67.3 | 65.2 | 69.8 | 4.5 | +4.0 |
| 160 |  Sudan |
66.9 | 63.8 | 70.2 | 6.4 | +7.9 |
| 161 |  Zambia |
66.9 | 64.4 | 69.3 | 4.9 | +20.3 |
| 162 |  Kiribati |
66.9 | 64.9 | 68.6 | 3.7 | +2.2 |
| 163 |  Afghanistan |
66.8 | 65.2 | 68.3 | 3.2 | +11.8 |
| 164 |  South Africa |
66.7 | 63.1 | 70.2 | 7.0 | +8.3 |
| 165 |  Djibouti |
66.6 | 64.1 | 69.2 | 5.1 | +9.9 |
| 166 |  Papua New Guinea |
66.5 | 64.0 | 69.5 | 5.4 | +4.9 |
| 167 |  Gambia |
66.5 | 64.7 | 68.2 | 3.5 | +9.6 |
| 168 |  Congo |
66.4 | 64.7 | 68.2 | 3.5 | +11.0 |
| 169 |  Ghana |
66.1 | 63.7 | 68.6 | 4.9 | +7.9 |
| 170 |  Haiti |
65.5 | 62.2 | 68.8 | 6.6 | +7.3 |
| 171 |  Angola |
65.2 | 62.6 | 67.7 | 5.1 | +18.7 |
| 172 |  Guinea-Bissau |
64.6 | 62.1 | 66.9 | 4.8 | +14.0 |
| 173 |  Eswatini |
64.5 | 61.6 | 67.4 | 5.8 | +16.9 |
| 174 |  Cameroon |
64.5 | 62.3 | 66.8 | 4.5 | +11.2 |
| 175 |  Equatorial Guinea |
64.3 | 62.6 | 66.3 | 3.7 | +10.9 |
| 176 |  Madagascar |
64.3 | 62.5 | 66.1 | 3.6 | +6.3 |
| 177 |  Kenya |
64.2 | 62.0 | 66.5 | 4.5 | +8.1 |
| 178 |  Mozambique |
64.1 | 60.8 | 67.1 | 6.3 | +14.7 |
| 179 |  Burundi |
64.1 | 62.0 | 66.2 | 4.2 | +16.5 |
| 180 |  Zimbabwe |
63.6 | 61.0 | 65.9 | 4.9 | +17.6 |
| 181 |  Togo |
63.3 | 63.0 | 63.6 | 0.6 | +8.8 |
| 182 |  Liberia |
62.6 | 61.3 | 64.0 | 2.7 | +10.8 |
| 183 |  Nauru |
62.6 | 60.7 | 64.6 | 3.9 | +3.0 |
| 184 |  Ivory Coast |
62.4 | 60.5 | 64.7 | 4.2 | +11.0 |
| 185 |  DR Congo |
62.4 | 60.2 | 64.6 | 4.3 | +10.5 |
| 186 |  Sierra Leone |
62.3 | 60.6 | 64.1 | 3.5 | +17.5 |
| 187 |  Niger |
61.9 | 60.9 | 62.9 | 2.0 | +12.7 |
| 188 |  Burkina Faso |
61.6 | 59.4 | 63.8 | 4.4 | +10.8 |
| 189 |  Benin |
61.3 | 59.8 | 62.8 | 3.0 | +4.7 |
| 190 |  Guinea |
61.2 | 59.9 | 62.4 | 2.5 | +8.8 |
| 191 |  Mali |
61.1 | 59.7 | 62.6 | 3.0 | +10.5 |
| 192 |  Somalia |
59.3 | 56.8 | 61.9 | 5.1 | +8.5 |
| 193 |  Lesotho |
58.6 | 55.8 | 61.3 | 5.4 | +9.9 |
| 194 |  CAR |
58.2 | 56.0 | 60.1 | 4.1 | +11.5 |
| 195 |  South Sudan |
58.0 | 55.0 | 61.0 | 6.0 | +10.4 |
| 196 |  Chad |
55.6 | 53.7 | 57.6 | 3.9 | +7.6 |
| 197 |  Nigeria |
55.0 | 54.6 | 55.3 | 0.7 | +7.8 |
In 2026, life expectancy at birth ranges from 86.7 years in Monaco to 55.0 in Nigeria. Women live longer than men in every country; the gap is largest in Russia, at 11.6 years. Since 2000, life expectancy has risen the most in Malawi, by 21.8 years; it has fallen only in Dominica, by 0.1 years.
Life expectancy at birth is the number of years a newborn would live on average if the death rates of the year stayed the same for its whole life. The figures are the United Nations' estimates (World Population Prospects); the years after 2024 are the UN's projections.
Countries with the highest life expectancy (2026)
Countries with the lowest life expectancy (2026)
Of the ten countries with the highest life expectancy, six are in Europe; of the ten with the lowest, all are in Africa.
Life expectancy map, 1960–2026
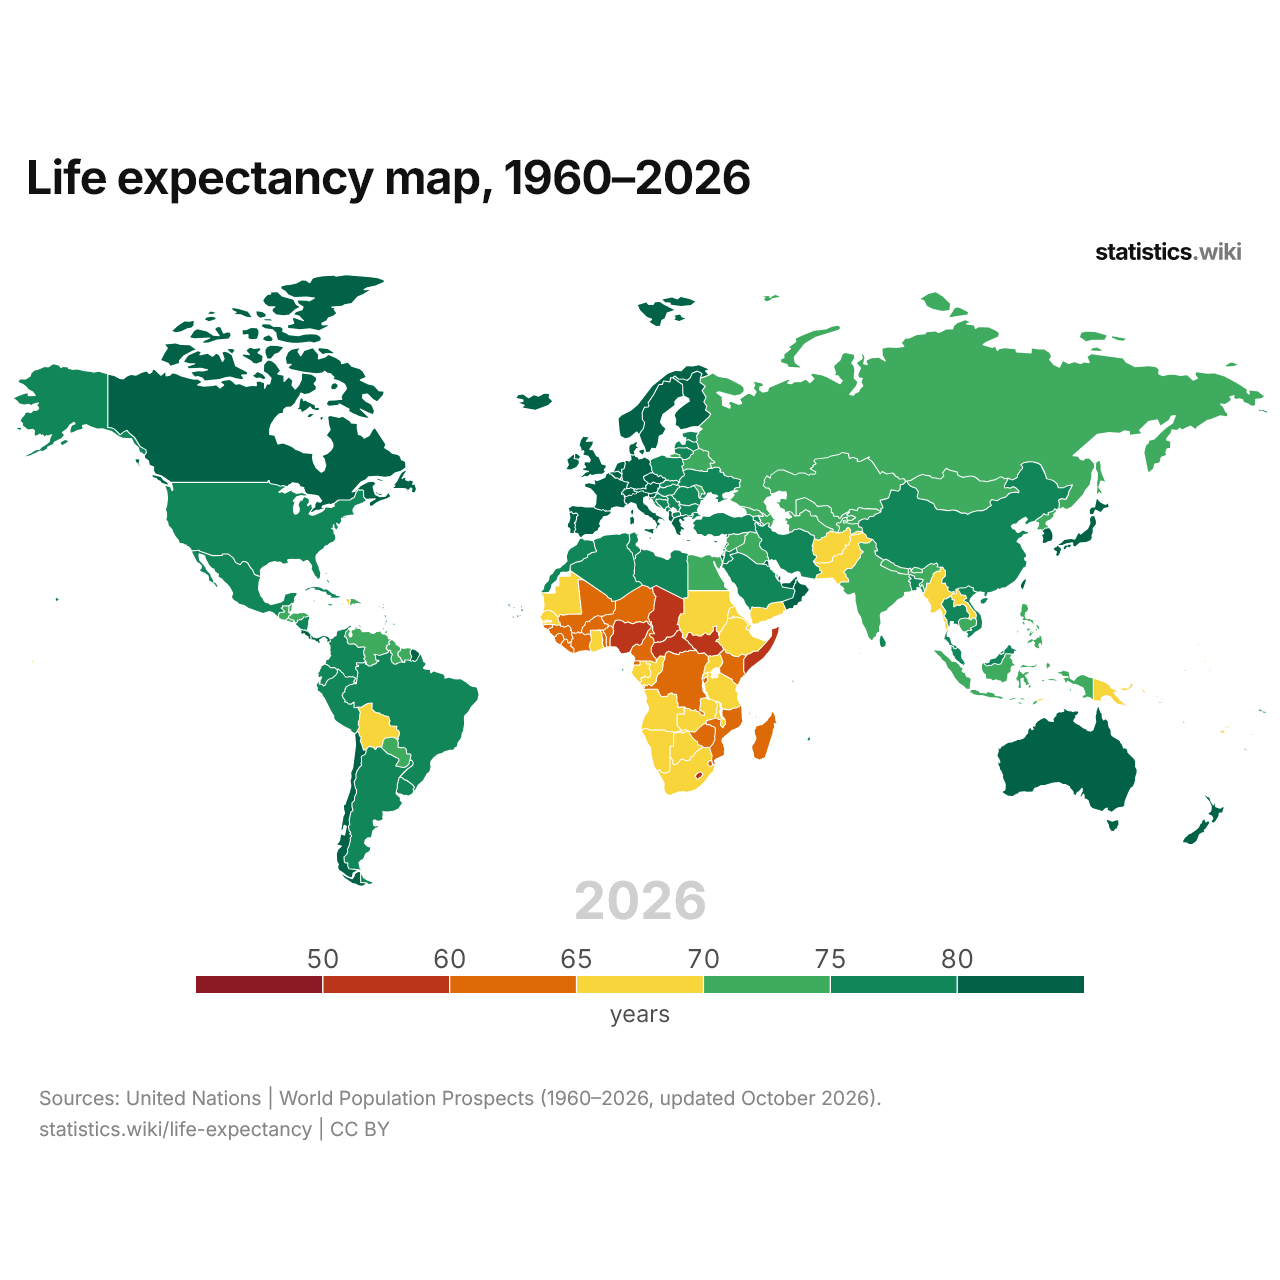
In 2026, life expectancy at birth is 80 years or more in 46 countries and below 60 years in 6. In 1960, no country reached 80 years and 129 were below 60.
Life expectancy in the 5 most populous countries, 1950–2026
| Year | Life expectancy, years | ||||
|---|---|---|---|---|---|
| United States | China | India | Indonesia | Pakistan | |
| 2026 projected | 79.8 | 79 | 72.7 | 71.6 | 68.1 |
| 2025 projected | 79.6 | 78.4 | 72.5 | 71.4 | 67.9 |
| 2024 | 79.5 | 78 | 72.2 | 71.3 | 67.8 |
| 2023 | 79.3 | 78 | 72 | 71.1 | 67.6 |
| 2022 | 78 | 78.2 | 71.7 | 70.9 | 67.4 |
| 2021 | 76.4 | 78.1 | 67.3 | 67.5 | 65.8 |
| 2020 | 77 | 78 | 70.2 | 68.8 | 65.7 |
| 2019 | 78.9 | 77.9 | 70.7 | 70.3 | 66.7 |
| 2018 | 78.8 | 77.7 | 70.4 | 70.1 | 66.5 |
| 2017 | 78.6 | 77.2 | 70.1 | 70 | 66.2 |
| 2016 | 78.7 | 77.2 | 69.7 | 69.7 | 65.9 |
| 2015 | 78.7 | 77 | 69.3 | 69.5 | 65.6 |
| 2014 | 78.9 | 76.7 | 68.9 | 69.3 | 65.4 |
| 2013 | 78.8 | 76.5 | 68.5 | 69.1 | 65.1 |
| 2012 | 78.8 | 76.2 | 68.1 | 68.9 | 64.9 |
| 2011 | 78.7 | 75.9 | 67.6 | 68.6 | 64.7 |
| 2010 | 78.7 | 75.7 | 67.2 | 68.4 | 64.4 |
| 2009 | 78.5 | 75.3 | 66.7 | 68.3 | 64.2 |
| 2008 | 78.1 | 74.8 | 66.2 | 68.1 | 64 |
| 2007 | 78 | 74.8 | 65.8 | 67.9 | 63.8 |
| 2006 | 77.8 | 74.4 | 65.4 | 67.7 | 63.6 |
| 2005 | 77.5 | 74.1 | 64.9 | 67.5 | 62.4 |
| 2004 | 77.5 | 73.7 | 64.5 | 65.5 | 63.1 |
| 2003 | 77.1 | 73.4 | 64.1 | 67.1 | 62.8 |
| 2002 | 77 | 73 | 63.6 | 67 | 62.6 |
| 2001 | 76.9 | 72.7 | 63.2 | 66.6 | 62.2 |
| 2000 | 76.8 | 72.3 | 62.7 | 66.3 | 61.9 |
| 1999 | 76.7 | 72 | 62.3 | 66 | 61.5 |
| 1998 | 76.7 | 71.6 | 61.9 | 65.9 | 61.1 |
| 1997 | 76.5 | 71.2 | 61.4 | 65.8 | 60.6 |
| 1996 | 76.2 | 70.8 | 61 | 65.5 | 60.5 |
| 1995 | 75.9 | 70.4 | 60.6 | 65.3 | 60.3 |
| 1994 | 75.7 | 69.8 | 60.2 | 65 | 60.2 |
| 1993 | 75.6 | 69.5 | 59.8 | 64.9 | 60.1 |
| 1992 | 75.8 | 69.1 | 59.4 | 64.2 | 60 |
| 1991 | 75.5 | 68.6 | 59 | 63.7 | 59.9 |
| 1990 | 75.4 | 68.2 | 58.6 | 63.2 | 59.7 |
| 1989 | 75.1 | 67.9 | 58.2 | 62.9 | 59.5 |
| 1988 | 74.8 | 67.6 | 57.7 | 62.4 | 59.4 |
| 1987 | 74.9 | 67.3 | 57.3 | 62.1 | 59.2 |
| 1986 | 74.7 | 66.9 | 56.8 | 61.7 | 59.2 |
| 1985 | 74.7 | 66.5 | 56.3 | 61.4 | 59.1 |
| 1984 | 74.7 | 66.1 | 55.8 | 60.9 | 58.9 |
| 1983 | 74.6 | 65.7 | 55.3 | 60.3 | 58.7 |
| 1982 | 74.5 | 65.2 | 54.7 | 59.7 | 58.3 |
| 1981 | 74.1 | 64.8 | 54.2 | 59.1 | 57.8 |
| 1980 | 73.7 | 64.2 | 53.6 | 58.7 | 57.2 |
| 1979 | 73.8 | 63.7 | 53 | 58.2 | 56.6 |
| 1978 | 73.4 | 63.1 | 52.4 | 57.6 | 56.1 |
| 1977 | 73.2 | 62.5 | 51.8 | 57.1 | 55.5 |
| 1976 | 72.8 | 61.2 | 51.3 | 56.4 | 55.1 |
| 1975 | 72.5 | 61 | 50.8 | 56 | 54.7 |
| 1974 | 72 | 60.2 | 50.3 | 55.4 | 54.3 |
| 1973 | 71.4 | 59.5 | 49.6 | 54.9 | 54.1 |
| 1972 | 71.2 | 58.6 | 49.2 | 54.4 | 53.8 |
| 1971 | 71.1 | 57.7 | 48.9 | 53.8 | 49 |
| 1970 | 70.7 | 56.8 | 48.6 | 53.3 | 52.9 |
| 1969 | 70.5 | 56 | 48.3 | 52.6 | 52.3 |
| 1968 | 70.2 | 55.2 | 47.9 | 51.9 | 51.6 |
| 1967 | 70.5 | 54.4 | 46.2 | 51.3 | 50.8 |
| 1966 | 70.2 | 53.7 | 45.9 | 48.4 | 49.8 |
| 1965 | 70.2 | 53 | 45.6 | 42.8 | 48.5 |
| 1964 | 70.2 | 52.3 | 46.7 | 49.4 | 47.8 |
| 1963 | 69.9 | 51.7 | 46.5 | 48.7 | 46.8 |
| 1962 | 70.1 | 51 | 46.1 | 48.1 | 45.9 |
| 1961 | 70.3 | 40.2 | 45.8 | 47.4 | 45 |
| 1960 | 69.8 | 33.4 | 45.6 | 46.8 | 44.1 |
| 1959 | 69.9 | 40.2 | 45.3 | 46.2 | 43.3 |
| 1958 | 69.7 | 48.8 | 44.8 | 45.4 | 42.5 |
| 1957 | 69.4 | 48.4 | 44.4 | 45 | 41.6 |
| 1956 | 69.6 | 47.8 | 44.1 | 44.3 | 40.6 |
| 1955 | 69.6 | 47.2 | 43.7 | 43.6 | 39.6 |
| 1954 | 69.5 | 46.8 | 43.2 | 42.9 | 38.6 |
| 1953 | 68.7 | 45.9 | 42.4 | 42.2 | 37.6 |
| 1952 | 68.4 | 45.3 | 42.1 | 41.5 | 36.5 |
| 1951 | 68.2 | 44.6 | 41.6 | 40.8 | 35.4 |
| 1950 | 68.1 | 43.8 | 41.2 | 40.2 | 34.2 |
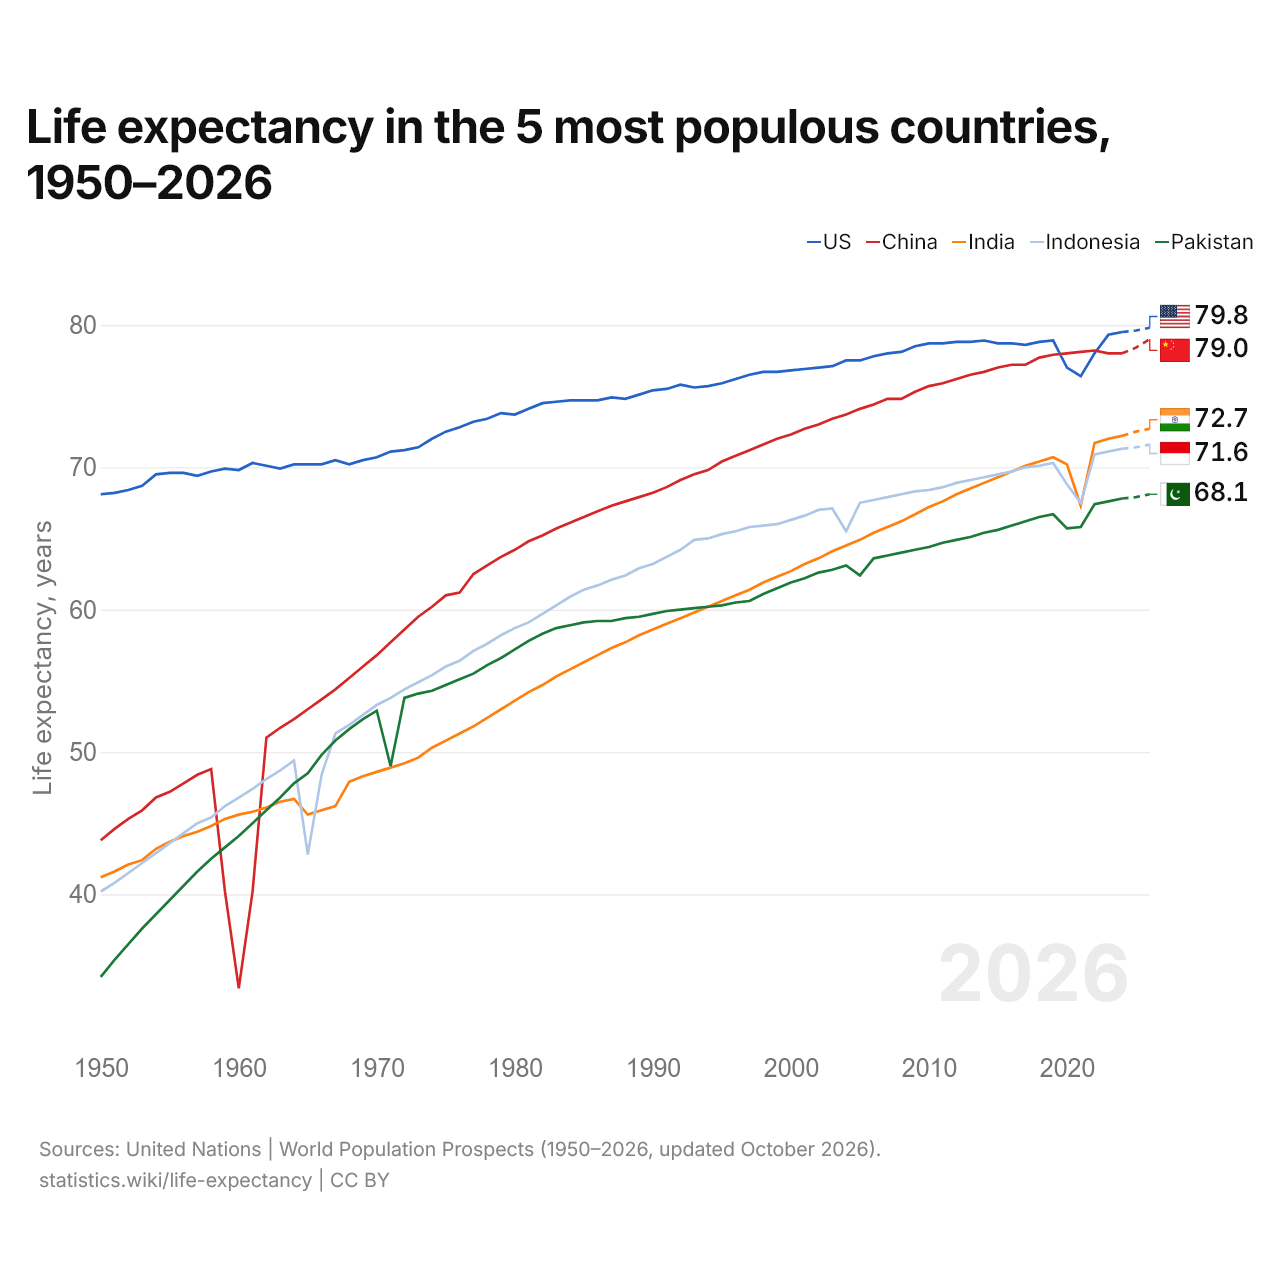
In 2026, life expectancy at birth among the five most populous countries is highest in the United States, at 79.8 years, and lowest in Pakistan, at 68.1. The gap between the highest and the lowest narrowed from 33.8 years in 1950 to 11.7 years.
World life expectancy of men and women, 1950–2026
| Year | Life expectancy, years | ||
|---|---|---|---|
| Both sexes | Men | Women | |
| 2026 projected | 73.8 | 71.2 | 76.4 |
| 2025 projected | 73.5 | 70.9 | 76.2 |
| 2024 | 73.3 | 70.7 | 76 |
| 2023 | 73.2 | 70.5 | 75.9 |
| 2022 | 72.6 | 70 | 75.4 |
| 2021 | 70.9 | 68.3 | 73.5 |
| 2020 | 71.9 | 69.3 | 74.7 |
| 2019 | 72.6 | 70.1 | 75.2 |
| 2018 | 72.4 | 69.8 | 75 |
| 2017 | 72.1 | 69.5 | 74.7 |
| 2016 | 71.9 | 69.3 | 74.5 |
| 2015 | 71.6 | 69.1 | 74.2 |
| 2014 | 71.4 | 68.9 | 74 |
| 2013 | 71.1 | 68.6 | 73.7 |
| 2012 | 70.8 | 68.3 | 73.4 |
| 2011 | 70.4 | 67.9 | 73 |
| 2010 | 70.1 | 67.6 | 72.7 |
| 2009 | 69.7 | 67.1 | 72.3 |
| 2008 | 69.3 | 66.8 | 71.9 |
| 2007 | 69 | 66.5 | 71.6 |
| 2006 | 68.6 | 66.1 | 71.2 |
| 2005 | 68.1 | 65.7 | 70.7 |
| 2004 | 67.7 | 65.3 | 70.3 |
| 2003 | 67.4 | 65 | 69.9 |
| 2002 | 67.1 | 64.6 | 69.6 |
| 2001 | 66.8 | 64.3 | 69.2 |
| 2000 | 66.4 | 64 | 68.9 |
| 1999 | 66 | 63.6 | 68.5 |
| 1998 | 65.7 | 63.3 | 68.2 |
| 1997 | 65.5 | 63.1 | 68 |
| 1996 | 65.2 | 62.7 | 67.7 |
| 1995 | 64.9 | 62.4 | 67.5 |
| 1994 | 64.3 | 61.8 | 66.9 |
| 1993 | 64.4 | 61.9 | 67 |
| 1992 | 64.3 | 61.8 | 66.8 |
| 1991 | 64.1 | 61.6 | 66.5 |
| 1990 | 64 | 61.5 | 66.4 |
| 1989 | 63.8 | 61.4 | 66.3 |
| 1988 | 63.4 | 61 | 65.8 |
| 1987 | 63.2 | 60.8 | 65.6 |
| 1986 | 62.7 | 60.3 | 65.2 |
| 1985 | 62.2 | 59.8 | 64.7 |
| 1984 | 61.9 | 59.5 | 64.3 |
| 1983 | 61.5 | 59.1 | 64 |
| 1982 | 61.3 | 58.9 | 63.8 |
| 1981 | 60.9 | 58.5 | 63.3 |
| 1980 | 60.5 | 58.2 | 62.9 |
| 1979 | 60.2 | 57.9 | 62.5 |
| 1978 | 59.5 | 57.3 | 61.8 |
| 1977 | 59.2 | 56.9 | 61.4 |
| 1976 | 58.6 | 56.4 | 60.7 |
| 1975 | 58.3 | 56.1 | 60.5 |
| 1974 | 58.1 | 55.9 | 60.2 |
| 1973 | 57.7 | 55.6 | 59.8 |
| 1972 | 57.2 | 55.1 | 59.3 |
| 1971 | 56 | 53.7 | 58.4 |
| 1970 | 56.3 | 54.3 | 58.3 |
| 1969 | 56 | 54 | 58.1 |
| 1968 | 55.6 | 53.6 | 57.7 |
| 1967 | 55.1 | 53.1 | 57.1 |
| 1966 | 54.6 | 52.6 | 56.6 |
| 1965 | 54 | 52 | 56.1 |
| 1964 | 54.3 | 52.3 | 56.2 |
| 1963 | 53.7 | 51.9 | 55.6 |
| 1962 | 53.2 | 51.4 | 55.1 |
| 1961 | 50.3 | 48.6 | 52.2 |
| 1960 | 47.8 | 46.1 | 49.6 |
| 1959 | 49.6 | 47.8 | 51.4 |
| 1958 | 51.6 | 49.9 | 53.4 |
| 1957 | 51.1 | 49.3 | 52.8 |
| 1956 | 50.7 | 49 | 52.5 |
| 1955 | 50.2 | 48.5 | 51.9 |
| 1954 | 49.7 | 48 | 51.3 |
| 1953 | 48.8 | 47.2 | 50.5 |
| 1952 | 48.2 | 46.5 | 50 |
| 1951 | 47.1 | 45.3 | 49 |
| 1950 | 46.4 | 44.5 | 48.4 |
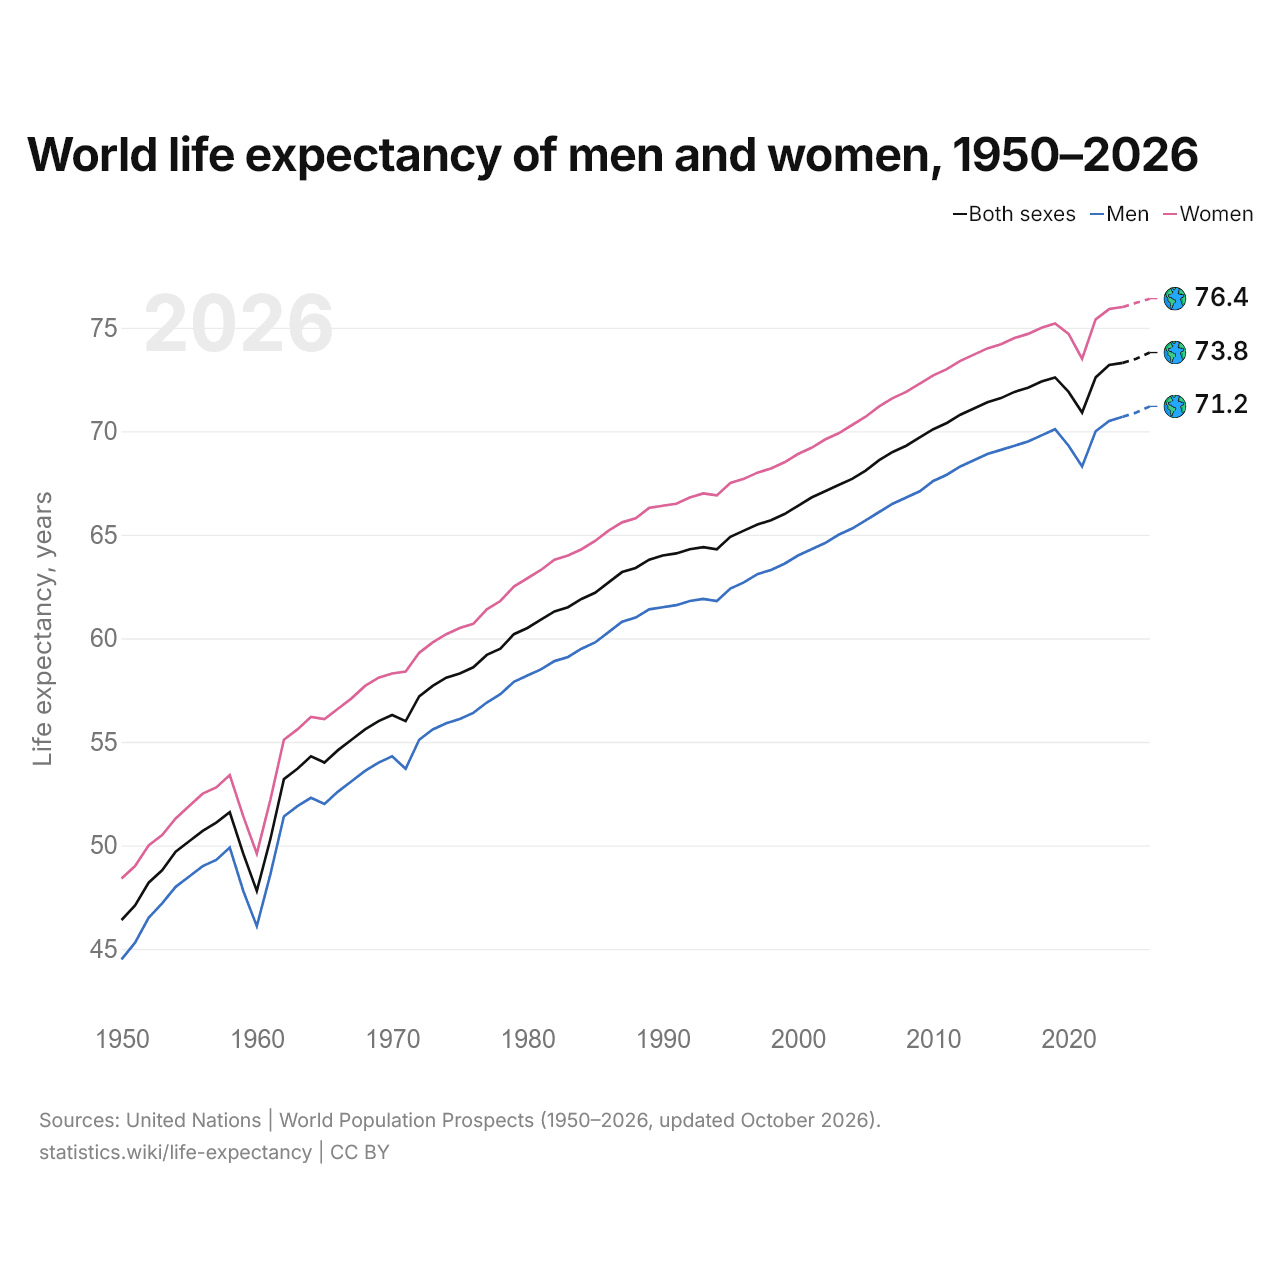
World life expectancy at birth is 73.8 years in 2026: 76.4 for women and 71.2 for men. In 1950 it was 46.4 years. Its largest falls were in 1959–1960, by 3.8 years, and in 2020–2021, by 1.7 years.
Life expectancy by region, 1950–2026
| Year | Life expectancy, years | ||||||
|---|---|---|---|---|---|---|---|
| North America | Europe | Oceania | Latin America | Asia | World | Africa | |
| 2026 projected | 80.1 | 79.9 | 79.2 | 76.1 | 75.2 | 73.8 | 64.8 |
| 2025 projected | 80 | 79.8 | 79 | 76 | 74.8 | 73.5 | 64.6 |
| 2024 | 79.8 | 79.6 | 78.9 | 75.8 | 74.6 | 73.3 | 64.4 |
| 2023 | 79.7 | 79.4 | 78.8 | 75.6 | 74.4 | 73.2 | 64.2 |
| 2022 | 78.3 | 78.6 | 77.7 | 74.6 | 74.2 | 72.6 | 63.5 |
| 2021 | 77 | 77.8 | 78 | 71.7 | 72.2 | 70.9 | 62.3 |
| 2020 | 77.5 | 78.1 | 78.4 | 73.1 | 73.3 | 71.9 | 62.7 |
| 2019 | 79.3 | 79.1 | 78.1 | 75.2 | 73.7 | 72.6 | 62.9 |
| 2018 | 79.1 | 78.9 | 78.1 | 75 | 73.5 | 72.4 | 62.5 |
| 2017 | 79 | 78.8 | 77.7 | 74.8 | 73.1 | 72.1 | 62 |
| 2016 | 79 | 78.6 | 77.7 | 74.6 | 72.9 | 71.9 | 61.6 |
| 2015 | 79.1 | 78.3 | 77.5 | 74.7 | 72.6 | 71.6 | 61.3 |
| 2014 | 79.2 | 78.2 | 77.3 | 74.5 | 72.3 | 71.4 | 60.9 |
| 2013 | 79.1 | 78 | 77.3 | 74.3 | 72 | 71.1 | 60.6 |
| 2012 | 79.1 | 77.6 | 77 | 74.1 | 71.7 | 70.8 | 60.1 |
| 2011 | 79 | 77.5 | 76.8 | 73.8 | 71.4 | 70.4 | 59.4 |
| 2010 | 79 | 76.9 | 76.7 | 73.3 | 71.1 | 70.1 | 59.1 |
| 2009 | 78.8 | 76.8 | 76.4 | 73.4 | 70.7 | 69.7 | 58.5 |
| 2008 | 78.4 | 76.4 | 76.1 | 73.2 | 70.3 | 69.3 | 58 |
| 2007 | 78.3 | 76.1 | 75.9 | 73 | 70.1 | 69 | 57.4 |
| 2006 | 78.1 | 75.8 | 75.9 | 72.7 | 69.7 | 68.6 | 56.8 |
| 2005 | 77.8 | 75.3 | 75.7 | 72.5 | 69.3 | 68.1 | 56.2 |
| 2004 | 77.8 | 75.2 | 75.4 | 72.1 | 68.9 | 67.7 | 55.7 |
| 2003 | 77.4 | 74.7 | 75.2 | 71.8 | 68.6 | 67.4 | 55.2 |
| 2002 | 77.3 | 74.6 | 74.9 | 71.5 | 68.3 | 67.1 | 54.7 |
| 2001 | 77.2 | 74.6 | 74.9 | 71 | 67.9 | 66.8 | 54.3 |
| 2000 | 77.1 | 74.4 | 74.6 | 70.8 | 67.5 | 66.4 | 53.9 |
| 1999 | 76.9 | 74.2 | 74.3 | 70.4 | 67 | 66 | 53.2 |
| 1998 | 76.9 | 74.3 | 73.9 | 70 | 66.7 | 65.7 | 52.8 |
| 1997 | 76.7 | 74.1 | 73.8 | 69.8 | 66.3 | 65.5 | 52.7 |
| 1996 | 76.4 | 73.6 | 73.5 | 69.4 | 65.9 | 65.2 | 52.5 |
| 1995 | 76.1 | 73.2 | 73.4 | 69 | 65.5 | 64.9 | 52.4 |
| 1994 | 76 | 73.1 | 73.1 | 68.6 | 65.2 | 64.3 | 52 |
| 1993 | 75.8 | 73 | 73.1 | 68.3 | 64.9 | 64.4 | 51.9 |
| 1992 | 76 | 73.5 | 72.7 | 67.9 | 64.5 | 64.3 | 51.5 |
| 1991 | 75.7 | 73.7 | 72.6 | 67.6 | 64 | 64.1 | 51.5 |
| 1990 | 75.6 | 73.7 | 72.2 | 67.3 | 63.6 | 64 | 51.5 |
| 1989 | 75.3 | 73.7 | 71.6 | 67 | 63.3 | 63.8 | 51.5 |
| 1988 | 75.1 | 73.7 | 71.6 | 66.6 | 62.9 | 63.4 | 51.2 |
| 1987 | 75.1 | 73.6 | 71.3 | 66.2 | 62.5 | 63.2 | 51.1 |
| 1986 | 74.9 | 73.3 | 71.2 | 65.9 | 62.1 | 62.7 | 50.4 |
| 1985 | 74.8 | 72.8 | 70.8 | 65.2 | 61.7 | 62.2 | 49.9 |
| 1984 | 74.9 | 72.6 | 70.8 | 65 | 61.2 | 61.9 | 49.6 |
| 1983 | 74.7 | 72.4 | 70.6 | 64.6 | 60.8 | 61.5 | 49.3 |
| 1982 | 74.6 | 72.4 | 70.1 | 64 | 60.3 | 61.3 | 49.9 |
| 1981 | 74.3 | 72.1 | 70 | 63.7 | 59.8 | 60.9 | 49.5 |
| 1980 | 73.9 | 71.9 | 69.7 | 63.3 | 59.4 | 60.5 | 49.1 |
| 1979 | 73.9 | 71.8 | 69.5 | 62.9 | 58.9 | 60.2 | 48.7 |
| 1978 | 73.5 | 71.7 | 69 | 62.6 | 58.2 | 59.5 | 48.2 |
| 1977 | 73.3 | 71.6 | 68.6 | 62.2 | 57.7 | 59.2 | 47.8 |
| 1976 | 73 | 71.4 | 68.1 | 61.5 | 57 | 58.6 | 47.3 |
| 1975 | 72.6 | 71.3 | 67.9 | 61.2 | 56.5 | 58.3 | 46.6 |
| 1974 | 72.1 | 71.3 | 67.2 | 60.6 | 55.9 | 58.1 | 46.2 |
| 1973 | 71.6 | 71.1 | 67.1 | 60.2 | 55.4 | 57.7 | 46 |
| 1972 | 71.4 | 71 | 66.8 | 59.7 | 54.8 | 57.2 | 45.5 |
| 1971 | 71.3 | 70.8 | 66.4 | 59.2 | 53.3 | 56 | 45.3 |
| 1970 | 70.9 | 70.6 | 65.7 | 58.3 | 53.5 | 56.3 | 45 |
| 1969 | 70.7 | 70.3 | 65.8 | 58.3 | 53.2 | 56 | 44.6 |
| 1968 | 70.4 | 70.5 | 65.4 | 58 | 52.6 | 55.6 | 44.3 |
| 1967 | 70.7 | 70.6 | 65.5 | 57.6 | 51.7 | 55.1 | 43.8 |
| 1966 | 70.4 | 70.5 | 65 | 57.2 | 51 | 54.6 | 43.5 |
| 1965 | 70.4 | 70.3 | 64.9 | 56.6 | 50.2 | 54 | 43.4 |
| 1964 | 70.4 | 70.3 | 64.6 | 56.2 | 50.6 | 54.3 | 43.1 |
| 1963 | 70.1 | 69.7 | 64.7 | 55.7 | 50 | 53.7 | 42.8 |
| 1962 | 70.2 | 69.5 | 64.4 | 55.3 | 49.5 | 53.2 | 42.4 |
| 1961 | 70.4 | 69.5 | 64.4 | 54.8 | 46.1 | 50.3 | 41.9 |
| 1960 | 70 | 69.1 | 64.1 | 54.2 | 43.8 | 47.8 | 41.6 |
| 1959 | 70 | 68.7 | 63.6 | 53.6 | 45.4 | 49.6 | 41.3 |
| 1958 | 69.8 | 68.5 | 63.7 | 53 | 47.5 | 51.6 | 40.4 |
| 1957 | 69.5 | 67.5 | 63.1 | 52.4 | 47 | 51.1 | 40 |
| 1956 | 69.7 | 67.4 | 62.8 | 51.8 | 46.5 | 50.7 | 40.1 |
| 1955 | 69.6 | 66.4 | 62.6 | 51.3 | 46 | 50.2 | 39.7 |
| 1954 | 69.5 | 65.7 | 62.3 | 50.7 | 45.3 | 49.7 | 39.2 |
| 1953 | 68.7 | 64.9 | 62 | 50 | 44.4 | 48.8 | 38.9 |
| 1952 | 68.4 | 64.2 | 61.3 | 49.4 | 43.8 | 48.2 | 38.4 |
| 1951 | 68.2 | 62.8 | 59.8 | 48.7 | 42.9 | 47.1 | 38 |
| 1950 | 68.1 | 62.8 | 60.9 | 48.1 | 42.2 | 46.4 | 37.6 |
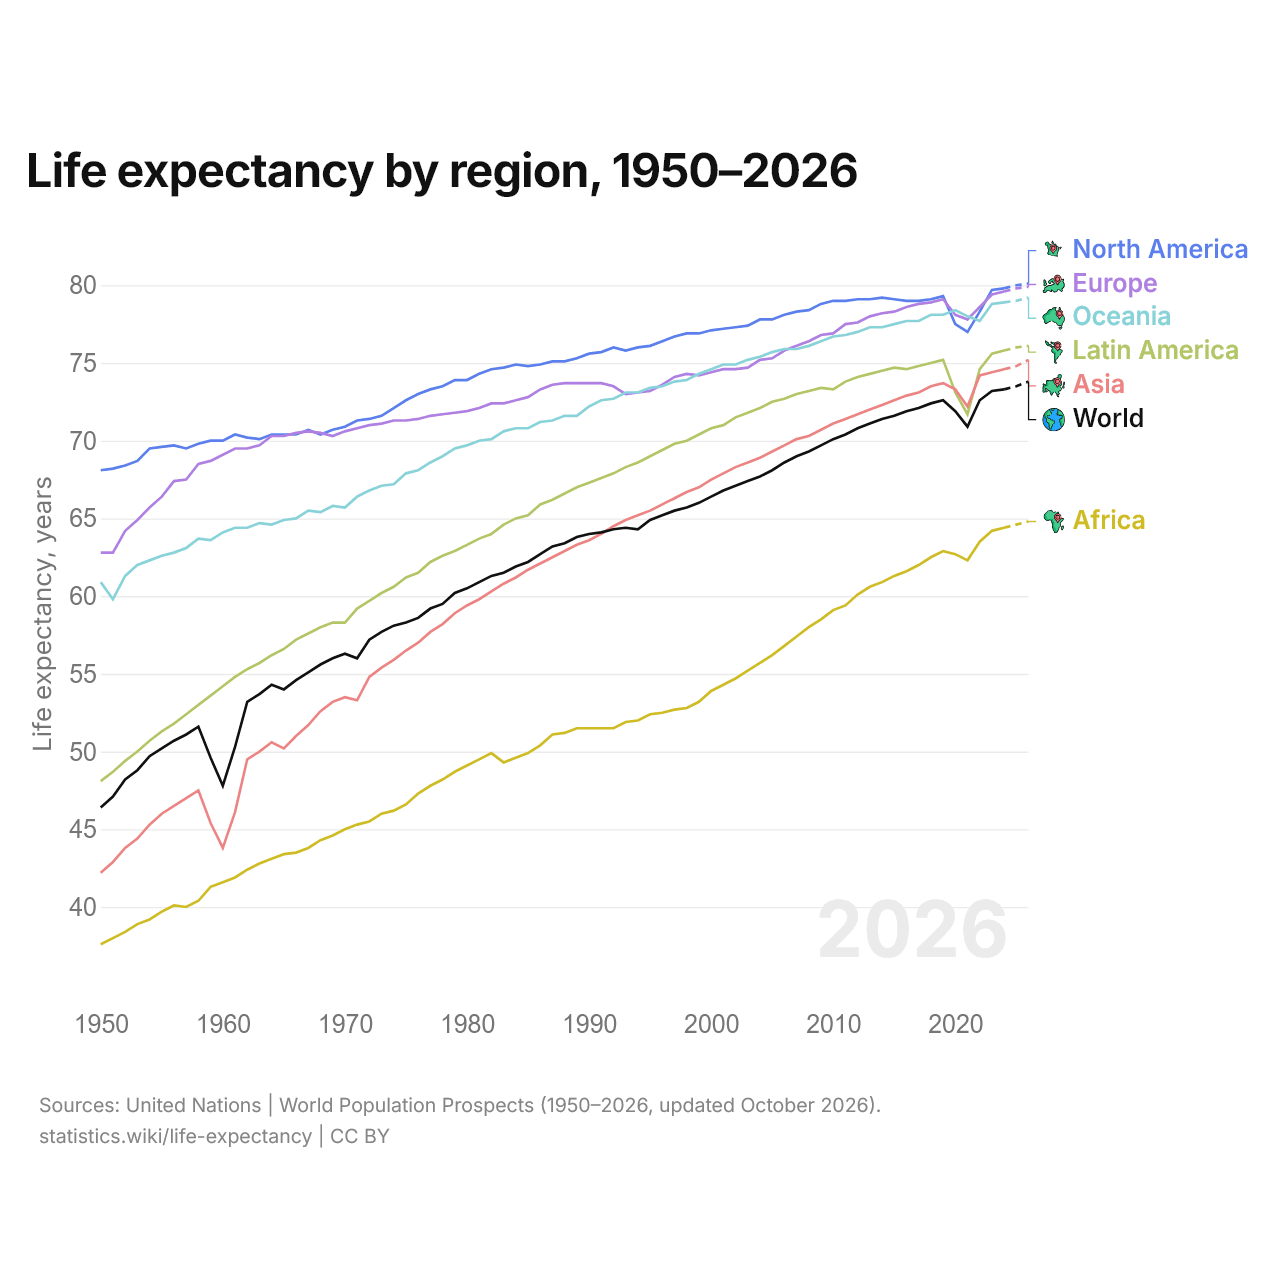
In 2026, life expectancy at birth is highest in North America, at 80.1 years, and lowest in Africa, at 64.8. Since 1950 it has risen the most in Asia, by 33.0 years.
Compare the life expectancy of any 2 countries
Sources:
- United Nations | World Population Prospects (1950–2026, updated October 2026)
Creative Commons Attribution (CC BY): you may copy, share, adapt and reuse this content, also commercially, as long as you credit statistics.wiki and note any changes you made. The sources listed above may have their own license terms.