
Life expectancy vs health spending per person (US$) by country
| Country (2023) | Region | Health spending per person | Life expectancy | Population | Difference from the line |
|---|---|---|---|---|---|
 Monaco |
Europe | $8,000 | 86.4 | 39K | +2.8 |
 San Marino |
Europe | $3,920 | 85.7 | 33.9K | +4.7 |
 Japan |
Asia | $3,640 | 84.7 | 125M | +4.0 |
 South Korea |
Asia | $3,040 | 84.3 | 51.7M | +4.2 |
 Andorra |
Europe | $3,610 | 84.0 | 80.9K | +3.3 |
 Switzerland |
Europe | $11,800 | 84.0 | 8.89M | −1.0 |
 Australia |
Oceania | $6,980 | 83.9 | 26.7M | +0.8 |
 Singapore |
Asia | $3,920 | 83.7 | 5.92M | +2.7 |
 Italy |
Europe | $3,280 | 83.7 | 59M | +3.3 |
 Spain |
Europe | $3,110 | 83.7 | 48.4M | +3.5 |
 Liechtenstein |
Europe | $11,500 | 83.6 | 39.8K | −1.2 |
 France |
Europe | $5,150 | 83.3 | 68.4M | +1.3 |
 Norway |
Europe | $8,300 | 83.3 | 5.52M | −0.4 |
 Malta |
Europe | $3,620 | 83.3 | 553K | +2.6 |
 Sweden |
Europe | $6,210 | 83.3 | 10.5M | +0.6 |
 United Arab Emirates |
Asia | $2,400 | 82.9 | 10.5M | +3.6 |
 Iceland |
Europe | $7,060 | 82.7 | 386K | −0.4 |
 Canada |
North America | $6,190 | 82.6 | 40M | +0.0 |
 Israel |
Asia | $3,930 | 82.4 | 9.85M | +1.4 |
 Ireland |
Europe | $6,880 | 82.4 | 5.31M | −0.6 |
 Qatar |
Asia | $1,800 | 82.4 | 2.66M | +4.1 |
 Portugal |
Europe | $2,760 | 82.4 | 10.6M | +2.6 |
 Luxembourg |
Europe | $7,510 | 82.2 | 666K | −1.1 |
 Netherlands |
Europe | $6,370 | 82.2 | 17.9M | −0.6 |
 Belgium |
Europe | $5,930 | 82.1 | 11.8M | −0.4 |
 New Zealand |
Oceania | $5,000 | 82.1 | 5.2M | +0.2 |
 Austria |
Europe | $6,270 | 82.0 | 9.13M | −0.7 |
 Denmark |
Europe | $6,510 | 81.9 | 5.95M | −0.9 |
 Finland |
Europe | $5,520 | 81.9 | 5.58M | −0.3 |
 Greece |
Europe | $1,960 | 81.9 | 10.4M | +3.3 |
 Cyprus |
Europe | $2,900 | 81.7 | 1.34M | +1.7 |
 Slovenia |
Europe | $3,040 | 81.6 | 2.12M | +1.5 |
 Germany |
Europe | $6,390 | 81.4 | 83.3M | −1.4 |
 United Kingdom |
Europe | $5,410 | 81.3 | 68.5M | −0.9 |
 Bahrain |
Asia | $1,180 | 81.3 | 1.58M | +4.6 |
 Chile |
Latin America | $1,740 | 81.2 | 19.7M | +3.1 |
 Maldives |
Asia | $1,160 | 81.0 | 526K | +4.4 |
 Costa Rica |
Latin America | $1,160 | 80.8 | 5.11M | +4.1 |
 Kuwait |
Asia | $1,680 | 80.4 | 4.85M | +2.4 |
 Oman |
Asia | $732 | 80.0 | 5.05M | +5.0 |
 Czech Republic |
Europe | $2,670 | 79.8 | 10.9M | +0.2 |
 Albania |
Europe | $591 | 79.6 | 2.41M | +5.4 |
 Panama |
Latin America | $1,560 | 79.6 | 4.46M | +1.9 |
 United States |
North America | $13,500 | 79.3 | 337M | −6.1 |
 Estonia |
Europe | $2,260 | 79.2 | 1.37M | +0.1 |
 Saudi Arabia |
Asia | $1,830 | 78.7 | 33.7M | +0.4 |
 Poland |
Europe | $1,580 | 78.6 | 36.7M | +0.9 |
 Croatia |
Europe | $1,550 | 78.6 | 3.86M | +0.9 |
 Slovakia |
Europe | $1,810 | 78.3 | 5.43M | +0.1 |
 Uruguay |
Latin America | $2,080 | 78.1 | 3.39M | −0.6 |
 China |
Asia | $763 | 78.0 | 1.41B | +2.8 |
 Bosnia and Herzegovina |
Europe | $773 | 77.9 | 3.19M | +2.6 |
 Lebanon |
Asia | $261 | 77.8 | 5.77M | +6.5 |
 Jordan |
Asia | $342 | 77.8 | 11.4M | +5.5 |
 Peru |
Latin America | $446 | 77.7 | 33.8M | +4.5 |
 Colombia |
Latin America | $571 | 77.7 | 52.3M | +3.6 |
 Iran |
Asia | $267 | 77.7 | 90.6M | +6.3 |
 Antigua and Barbuda |
Latin America | $841 | 77.6 | 93.3K | +2.1 |
 Sri Lanka |
Asia | $134 | 77.5 | 22M | +8.5 |
 North Macedonia |
Europe | $639 | 77.4 | 1.83M | +2.9 |
 Ecuador |
Latin America | $509 | 77.4 | 18M | +3.7 |
 Argentina |
Latin America | $1,460 | 77.4 | 45.5M | −0.1 |
 Turkey |
Asia | $548 | 77.2 | 85.3M | +3.2 |
 Montenegro |
Europe | $1,150 | 77.1 | 624K | +0.5 |
 Hungary |
Europe | $1,420 | 77.0 | 9.59M | −0.4 |
 Serbia |
Europe | $984 | 76.8 | 6.62M | +0.7 |
 Malaysia |
Asia | $450 | 76.7 | 35.1M | +3.4 |
 Tunisia |
Africa | $318 | 76.5 | 12.2M | +4.5 |
 Thailand |
Asia | $327 | 76.4 | 71.7M | +4.3 |
 Algeria |
Africa | $233 | 76.3 | 46.2M | +5.3 |
 Latvia |
Europe | $1,650 | 76.2 | 1.88M | −1.7 |
 Barbados |
Latin America | $1,290 | 76.2 | 282K | −0.9 |
 Cape Verde |
Africa | $290 | 76.1 | 522K | +4.4 |
 Lithuania |
Europe | $2,040 | 76.0 | 2.87M | −2.6 |
 Romania |
Europe | $1,050 | 75.9 | 19.1M | −0.4 |
 Brazil |
Latin America | $1,010 | 75.9 | 211M | −0.3 |
 Armenia |
Asia | $767 | 75.7 | 2.96M | +0.5 |
 Bulgaria |
Europe | $1,260 | 75.6 | 6.45M | −1.3 |
 Brunei |
Asia | $733 | 75.3 | 459K | +0.3 |
 Morocco |
Africa | $232 | 75.3 | 37.7M | +4.4 |
 Grenada |
Latin America | $526 | 75.2 | 117K | +1.4 |
 Mexico |
Latin America | $761 | 75.1 | 130M | −0.1 |
 Nicaragua |
Latin America | $217 | 75.0 | 6.82M | +4.3 |
 Mauritius |
Africa | $616 | 74.9 | 1.25M | +0.5 |
 Bangladesh |
Asia | $53.5 | 74.7 | 171M | +9.0 |
 Vietnam |
Asia | $197 | 74.6 | 100M | +4.3 |
 Bahamas |
Latin America | $2,260 | 74.6 | 399K | −4.5 |
 Georgia |
Asia | $554 | 74.5 | 3.72M | +0.5 |
 Belarus |
Europe | $558 | 74.4 | 9.18M | +0.4 |
 Azerbaijan |
Asia | $300 | 74.4 | 10.2M | +2.6 |
 Kazakhstan |
Asia | $490 | 74.4 | 20.3M | +0.8 |
 Paraguay |
Latin America | $527 | 73.8 | 6.84M | +0.0 |
 Dominican Republic |
Latin America | $489 | 73.7 | 11.3M | +0.2 |
 Suriname |
Latin America | $297 | 73.6 | 629K | +1.8 |
 Belize |
Latin America | $309 | 73.6 | 411K | +1.6 |
 Trinidad and Tobago |
Latin America | $1,280 | 73.5 | 1.37M | −3.5 |
 Russia |
Europe | $1,000 | 73.2 | 144M | −3.0 |
 Bhutan |
Asia | $162 | 73.0 | 786K | +3.4 |
 Tonga |
Oceania | $358 | 72.9 | 105K | +0.4 |
 Honduras |
Latin America | $249 | 72.9 | 10.6M | +1.7 |
 Seychelles |
Africa | $766 | 72.9 | 120K | −2.3 |
 Saint Lucia |
Latin America | $641 | 72.7 | 179K | −1.8 |
 Guatemala |
Latin America | $392 | 72.6 | 18.1M | −0.2 |
 Venezuela |
Latin America | $186 | 72.5 | 28.3M | +2.4 |
 Uzbekistan |
Asia | $192 | 72.4 | 35.7M | +2.2 |
 Iraq |
Asia | $333 | 72.3 | 45.1M | +0.1 |
 Saint Kitts and Nevis |
Latin America | $1,290 | 72.1 | 46.8K | −4.9 |
 Syria |
Asia | $33.3 | 72.1 | 23.6M | +8.2 |
 El Salvador |
Latin America | $501 | 72.1 | 6.31M | −1.6 |
 India |
Asia | $84.7 | 72.0 | 1.44B | +4.7 |
 Tajikistan |
Asia | $85.1 | 71.8 | 10.4M | +4.5 |
 Mongolia |
Asia | $360 | 71.7 | 3.48M | −0.7 |
 Samoa |
Oceania | $293 | 71.7 | 217K | +0.0 |
 Kyrgyzstan |
Asia | $96.7 | 71.7 | 7.1M | +3.9 |
 Egypt |
Africa | $141 | 71.6 | 115M | +2.5 |
 Vanuatu |
Oceania | $143 | 71.5 | 320K | +2.3 |
 Jamaica |
Latin America | $520 | 71.5 | 2.84M | −2.3 |
 Saint Vincent |
Latin America | $469 | 71.2 | 101K | −2.2 |
 Moldova |
Europe | $452 | 71.2 | 2.46M | −2.1 |
 Indonesia |
Asia | $132 | 71.2 | 281M | +2.3 |
 Dominica |
Latin America | $492 | 71.1 | 66.5K | −2.5 |
 Cambodia |
Asia | $115 | 70.7 | 17.4M | +2.3 |
 Solomon Islands |
Oceania | $111 | 70.5 | 800K | +2.3 |
 Nepal |
Asia | $84 | 70.4 | 29.7M | +3.1 |
 Guyana |
Latin America | $505 | 70.2 | 826K | −3.5 |
 Turkmenistan |
Asia | $581 | 70.1 | 7.36M | −4.1 |
 Philippines |
Asia | $194 | 69.8 | 115M | −0.4 |
 Sao Tome and Principe |
Africa | $171 | 69.7 | 231K | −0.1 |
 Libya |
Africa | $470 | 69.3 | 7.31M | −4.1 |
 Yemen |
Asia | $47.8 | 69.3 | 39.4M | +4.1 |
 Palau |
Oceania | $1,680 | 69.3 | 17.7K | −8.7 |
 Botswana |
Africa | $490 | 69.2 | 2.48M | −4.4 |
 Laos |
Asia | $27.4 | 69.0 | 7.66M | +5.7 |
 Senegal |
Africa | $73.2 | 68.7 | 18.1M | +1.9 |
 Eritrea |
Africa | $28.3 | 68.6 | 3.47M | +5.3 |
 Bolivia |
Latin America | $255 | 68.6 | 12.2M | −2.7 |
 Mauritania |
Africa | $92.1 | 68.5 | 5.02M | +0.9 |
 Gabon |
Africa | $253 | 68.3 | 2.48M | −2.9 |
 Uganda |
Africa | $45.2 | 68.3 | 48.7M | +3.2 |
 Rwanda |
Africa | $52.7 | 67.8 | 14M | +2.2 |
 East Timor |
Asia | $144 | 67.7 | 1.38M | −1.5 |
 Pakistan |
Asia | $30.5 | 67.7 | 248M | +4.0 |
 Namibia |
Africa | $397 | 67.4 | 2.96M | −5.4 |
 Malawi |
Africa | $41.3 | 67.4 | 21.1M | +2.6 |
 Fiji |
Oceania | $213 | 67.3 | 924K | −3.3 |
 Ethiopia |
Africa | $34.8 | 67.3 | 129M | +3.2 |
 Tuvalu |
Oceania | $1,720 | 67.1 | 9.82K | −11.0 |
 Tanzania |
Africa | $36.3 | 67.0 | 66.6M | +2.7 |
 Marshall Islands |
Oceania | $894 | 67.0 | 38.8K | −8.8 |
 Myanmar |
Asia | $56.2 | 66.9 | 54.1M | +1.1 |
 Comoros |
Africa | $102 | 66.8 | 850K | −1.2 |
 Kiribati |
Oceania | $238 | 66.5 | 133K | −4.5 |
 Zambia |
Africa | $79.6 | 66.4 | 20.7M | −0.7 |
 Sudan |
Africa | $21.1 | 66.3 | 50M | +4.0 |
 South Africa |
Africa | $537 | 66.1 | 63.2M | −7.8 |
 Papua New Guinea |
Oceania | $85.2 | 66.1 | 10.4M | −1.2 |
 Afghanistan |
Asia | $59.1 | 66.0 | 41.5M | +0.0 |
 Djibouti |
Africa | $77.6 | 66.0 | 1.15M | −1.0 |
 Gambia |
Africa | $25.7 | 65.9 | 2.7M | +2.8 |
 Congo |
Africa | $75.6 | 65.8 | 6.18M | −1.1 |
 Ghana |
Africa | $70.3 | 65.5 | 33.8M | −1.1 |
 Palestine |
Asia | $346 | 65.2 | 5.17M | −7.2 |
 Haiti |
Latin America | $54.4 | 64.9 | 11.6M | −0.8 |
 Angola |
Africa | $76.1 | 64.6 | 36.7M | −2.3 |
 Eswatini |
Africa | $296 | 64.1 | 1.23M | −7.6 |
 Guinea-Bissau |
Africa | $82.1 | 64.1 | 2.15M | −3.1 |
 Equatorial Guinea |
Africa | $234 | 63.7 | 1.85M | −7.2 |
 Cameroon |
Africa | $79.1 | 63.7 | 28.4M | −3.3 |
 Kenya |
Africa | $85 | 63.7 | 55.3M | −3.7 |
 Burundi |
Africa | $28.1 | 63.7 | 13.7M | +0.3 |
 Madagascar |
Africa | $17.4 | 63.6 | 31.2M | +2.0 |
 Mozambique |
Africa | $53 | 63.6 | 33.6M | −2.0 |
 Zimbabwe |
Africa | $62.9 | 62.8 | 16.3M | −3.5 |
 Togo |
Africa | $59.6 | 62.7 | 8.22M | −3.3 |
 Liberia |
Africa | $104 | 62.2 | 5.49M | −5.9 |
 Nauru |
Oceania | $2,290 | 62.1 | 11.9K | −17.0 |
 Ivory Coast |
Africa | $87.7 | 61.9 | 31.2M | −5.5 |
 DR Congo |
Africa | $23.4 | 61.9 | 106M | −0.8 |
 Sierra Leone |
Africa | $35.8 | 61.8 | 8.46M | −2.4 |
 Niger |
Africa | $26 | 61.2 | 26.2M | −1.9 |
 Burkina Faso |
Africa | $71.7 | 61.1 | 23M | −5.6 |
 Benin |
Africa | $46.5 | 60.8 | 14.1M | −4.4 |
 Guinea |
Africa | $59.3 | 60.7 | 14.4M | −5.3 |
 Mali |
Africa | $34 | 60.4 | 23.8M | −3.6 |
 Somalia |
Africa | $22.4 | 58.8 | 18.4M | −3.7 |
 South Sudan |
Africa | $72.8 | 57.6 | 11.5M | −9.1 |
 Central African Republic |
Africa | $53.8 | 57.4 | 5.15M | −8.3 |
 Lesotho |
Africa | $123 | 57.4 | 2.31M | −11.3 |
 Chad |
Africa | $47.4 | 55.1 | 19.3M | −10.1 |
 Nigeria |
Africa | $66.8 | 54.5 | 228M | −12.0 |
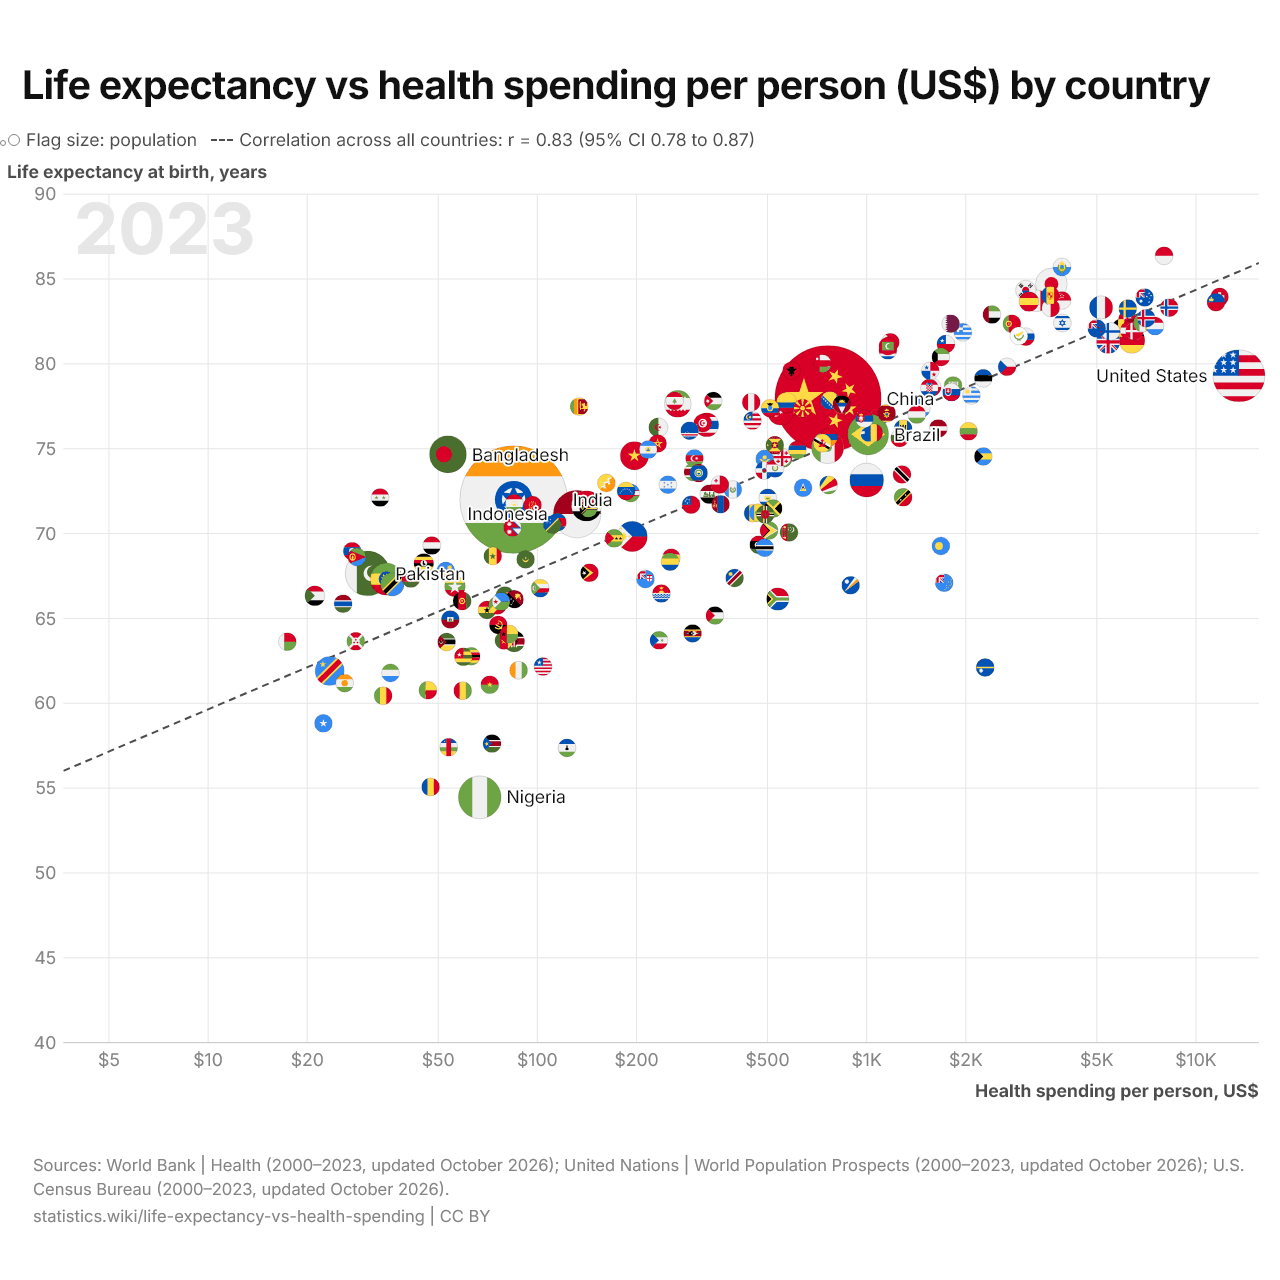
The chart plots life expectancy against health spending per person for 190 countries, and for every year back to 2000. Health spending per person ranges from $17.4 in Madagascar to $13,500 in the United States. Life expectancy ranges from 54.5 years in Nigeria to 86.4 years in Monaco. Across all countries, the correlation coefficient is 0.83, compared with 0.81 in 2000.
Life expectancy at birth is the number of years a newborn would live on average if the death rates of its birth year stayed the same throughout its life. Health spending per person is a country's yearly spending on health care, by the government, insurers and households together, divided by its population, in US dollars at that year's exchange rates. The correlation coefficient (Pearson's r) runs from −1 to 1: the closer it is to 1, the closer the countries lie to a rising straight line, and the closer it is to −1, the closer they lie to a falling one; near 0, they follow no straight line. Here it is computed with health spending on a logarithmic scale, as on the chart's horizontal axis, where each doubling takes the same width. Each country counts once, whatever the size of its population.
Life expectancy above and below the line fitted to all countries
- Pearson correlation of life expectancy and log health spending per person: 0.83 (95% confidence interval 0.78 to 0.87; 190 countries, 2023)
- Slope of the line fitted to all countries: +2.5 years per doubling of health spending per person
10 countries furthest above the line
10 countries furthest below the line
Along the line fitted to all countries, life expectancy is 67.9 years at $100 of health spending per person, 76.1 years at $1,000 and 84.4 years at $10,000. Bangladesh is furthest above the line: its life expectancy, 74.7 years with health spending per person of $53.5, is 9.0 years more than the line gives. Nauru is furthest below it: its life expectancy, 62.1 years with health spending per person of $2,290, is 17.0 years less than the line gives.
Sources:
- World Bank | Health (2000–2023, updated October 2026)
- United Nations | World Population Prospects (2000–2023, updated October 2026)
- U.S. Census Bureau (2000–2023, updated October 2026)
Creative Commons Attribution (CC BY): you may copy, share, adapt and reuse this content, also commercially, as long as you credit statistics.wiki and note any changes you made. The sources listed above may have their own license terms.