
Jordan life expectancy, 1950–2026
| Year | Life expectancy, years | World rank | ||
|---|---|---|---|---|
| Both sexes | Men | Women | ||
| 2026 projected | 78.3 | 76.2 | 80.6 | #58 |
| 2025 projected | 78.1 | 76.1 | 80.5 | #57 |
| 2024 | 78 | 75.9 | 80.3 | #57 |
| 2023 | 77.8 | 75.7 | 80.2 | #58 |
| 2022 | 77.1 | 75 | 79.4 | #58 |
| 2021 | 74.2 | 72.2 | 76.6 | #67 |
| 2020 | 75.6 | 73.4 | 78.3 | #68 |
| 2019 | 76.9 | 74.8 | 79.2 | #62 |
| 2018 | 76.5 | 74.5 | 78.8 | #68 |
| 2017 | 76.1 | 74.1 | 78.4 | #70 |
| 2016 | 75.6 | 73.6 | 77.8 | #73 |
| 2015 | 75.1 | 73.1 | 77.3 | #76 |
| 2014 | 74.6 | 72.7 | 76.9 | #81 |
| 2013 | 74.3 | 72.3 | 76.6 | #83 |
| 2012 | 74.1 | 72.1 | 76.4 | #82 |
| 2011 | 73.9 | 72 | 76.2 | #81 |
| 2010 | 73.8 | 71.9 | 76 | #78 |
| 2009 | 73.7 | 71.8 | 75.9 | #76 |
| 2008 | 73.6 | 71.7 | 75.8 | #77 |
| 2007 | 73.4 | 71.5 | 75.6 | #75 |
| 2006 | 73.2 | 71.3 | 75.4 | #76 |
| 2005 | 73 | 71.1 | 75.2 | #77 |
| 2004 | 72.8 | 70.9 | 74.9 | #73 |
| 2003 | 72.6 | 70.7 | 74.7 | #73 |
| 2002 | 72.4 | 70.5 | 74.5 | #75 |
| 2001 | 72.1 | 70.3 | 74.3 | #73 |
| 2000 | 71.9 | 70.1 | 74.1 | #74 |
| 1999 | 71.7 | 69.9 | 73.8 | #71 |
| 1998 | 71.5 | 69.7 | 73.6 | #72 |
| 1997 | 71.3 | 69.6 | 73.4 | #71 |
| 1996 | 71.1 | 69.4 | 73.1 | #71 |
| 1995 | 70.9 | 69.2 | 72.8 | #70 |
| 1994 | 70.7 | 69.1 | 72.6 | #70 |
| 1993 | 70.6 | 69 | 72.3 | #71 |
| 1992 | 70.4 | 68.9 | 72.1 | #70 |
| 1991 | 70.2 | 68.7 | 71.9 | #74 |
| 1990 | 70.1 | 68.6 | 71.6 | #73 |
| 1989 | 69.9 | 68.5 | 71.3 | #76 |
| 1988 | 69.6 | 68.3 | 71 | #78 |
| 1987 | 69.3 | 68.1 | 70.6 | #78 |
| 1986 | 69 | 67.8 | 70.1 | #81 |
| 1985 | 68.6 | 67.5 | 69.7 | #80 |
| 1984 | 68.2 | 67.2 | 69.2 | #81 |
| 1983 | 67.8 | 66.8 | 68.8 | #81 |
| 1982 | 67.4 | 66.4 | 68.3 | #82 |
| 1981 | 66.9 | 66 | 67.9 | #84 |
| 1980 | 66.5 | 65.5 | 67.5 | #85 |
| 1979 | 66 | 65 | 67.1 | #85 |
| 1978 | 65.6 | 64.5 | 66.7 | #85 |
| 1977 | 65.1 | 64.1 | 66.2 | #85 |
| 1976 | 64.7 | 63.6 | 65.8 | #85 |
| 1975 | 64.1 | 63.1 | 65.3 | #86 |
| 1974 | 63.6 | 62.5 | 64.8 | #86 |
| 1973 | 63.1 | 62 | 64.2 | #88 |
| 1972 | 62.5 | 61.5 | 63.6 | #90 |
| 1971 | 61.8 | 60.7 | 62.9 | #89 |
| 1970 | 59.8 | 58.4 | 61.4 | #99 |
| 1969 | 60.5 | 59.7 | 61.4 | #92 |
| 1968 | 59.8 | 59 | 60.6 | #92 |
| 1967 | 59 | 58.3 | 59.8 | #96 |
| 1966 | 57.8 | 57.1 | 58.5 | #97 |
| 1965 | 57.3 | 56.7 | 58 | #97 |
| 1964 | 56.5 | 55.9 | 57.1 | #97 |
| 1963 | 55.5 | 55 | 56.1 | #101 |
| 1962 | 54.6 | 54.2 | 55.2 | #103 |
| 1961 | 53.7 | 53.3 | 54.1 | #103 |
| 1960 | 52.7 | 52.4 | 53.1 | #106 |
| 1959 | 51.6 | 51.4 | 51.9 | #109 |
| 1958 | 50.4 | 50.3 | 50.7 | #109 |
| 1957 | 49.2 | 49.1 | 49.4 | #112 |
| 1956 | 48 | 47.9 | 48.2 | #118 |
| 1955 | 46.8 | 46.6 | 47 | #122 |
| 1954 | 45.6 | 45.3 | 46 | #123 |
| 1953 | 44.4 | 44.1 | 44.9 | #123 |
| 1952 | 43.2 | 42.9 | 43.6 | #127 |
| 1951 | 42 | 41.6 | 42.5 | #129 |
| 1950 | 40.9 | 40.5 | 41.4 | #135 |
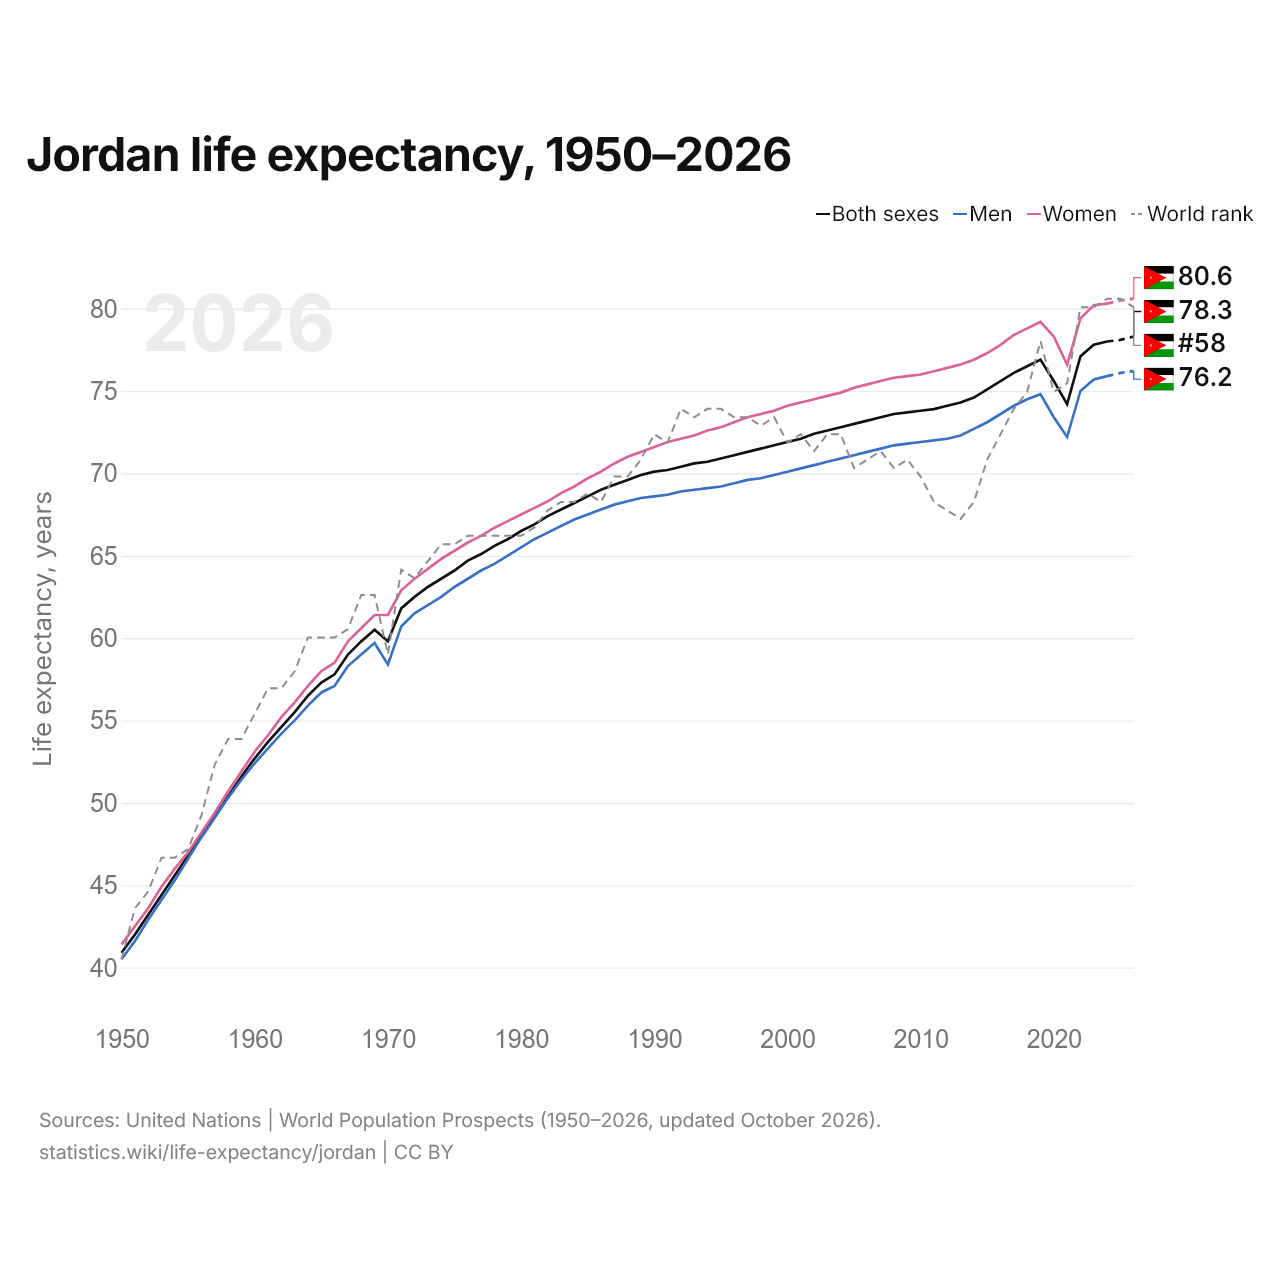
In 2026, life expectancy at birth in Jordan is 78.3 years: 80.6 for women and 76.2 for men. It is the 58th highest in the world, down from 57th in 2025. Its highest rank was 57th, last held in 2025. In 1950 it was 40.9 years.
Jordan's life expectancy is the 15th highest of the 48 countries of Asia, where it ranges from Afghanistan's 66.8 years to Japan's 85.1. Jordan's life expectancy rose above 70 years in 1990. The largest ten-year rise in Jordan's life expectancy was from 1950 to 1960, by 11.8 years.
Healthy life expectancy at birth in Jordan is 68.6 years, the 32nd highest in the world. In 2026, a 65-year-old in Jordan can expect to live another 17.6 years, the 74th highest life expectancy at 65 in the world.
Jordan in the world life expectancy ranking, 2026
| Rank | Country | Life expectancy | Men | Women | Difference between women and men | Change since 2000 | |
|---|---|---|---|---|---|---|---|
| 55 |
 Uruguay |
78.6 | 74.8 | 82.3 | 7.5 | +3.9 | |
| 56 |
 Bosnia |
78.4 | 75.1 | 81.4 | 6.3 | +3.1 | |
| 57 |
 Turkey |
78.4 | 75.5 | 81.3 | 5.8 | +6.4 | vs Turkey |
| 58 |
 Jordan |
78.3 | 76.2 | 80.6 | 4.4 | +6.4 | |
| 59 |
 Peru |
78.3 | 76.0 | 80.6 | 4.6 | +8.5 | |
| 60 |
 Colombia |
78.3 | 75.6 | 80.9 | 5.4 | +7.4 | |
| 61 |
 Iran |
78.2 | 76.4 | 80.2 | 3.7 | +8.1 | vs Iran |
Compare Jordan life expectancy with other countries
Sources:
- United Nations | World Population Prospects (1950–2026, updated October 2026)
Creative Commons Attribution (CC BY): you may copy, share, adapt and reuse this content, also commercially, as long as you credit statistics.wiki and note any changes you made. The sources listed above may have their own license terms.