
Healthy life expectancy (HALE) by country
| Rank | Country | At birth | Men | Women | At 60 |
|---|---|---|---|---|---|
 World |
63.1 | 62.0 | 64.2 | 14.9 | |
| 1 |  Singapore |
72.9 | 71.6 | 74.2 | 19.6 |
| 2 |  Japan |
72.2 | 70.9 | 73.5 | 19.5 |
| 3 |  South Korea |
72.0 | 70.2 | 73.7 | 19.4 |
| 4 |  Luxembourg |
71.4 | 71.2 | 71.6 | 19.0 |
| 5 |  Italy |
71.2 | 70.6 | 71.7 | 18.9 |
| 5 |  Spain |
71.2 | 70.2 | 72.1 | 19.1 |
| 5 |  Switzerland |
71.2 | 71.0 | 71.4 | 19.2 |
| 8 |  Israel |
71.0 | 70.1 | 71.9 | 19.5 |
| 9 |  Malta |
70.8 | 70.5 | 71.1 | 18.9 |
| 10 |  Sweden |
70.6 | 70.2 | 70.9 | 18.5 |
| 11 |  Norway |
70.4 | 70.3 | 70.5 | 18.3 |
| 12 |  Cyprus |
70.3 | 69.8 | 70.8 | 18.3 |
| 12 |  Denmark |
70.3 | 69.8 | 70.9 | 18.2 |
| 14 |  Ireland |
70.2 | 70.0 | 70.5 | 18.4 |
| 14 |  UAE |
70.2 | 70.7 | 69.3 | 18.2 |
| 16 |  France |
70.0 | 68.9 | 71.0 | 18.6 |
| 17 |  Austria |
69.9 | 68.9 | 70.8 | 17.9 |
| 17 |  Belgium |
69.9 | 69.5 | 70.3 | 18.1 |
| 19 |  Greece |
69.8 | 68.5 | 71.1 | 18.2 |
| 19 |  Iceland |
69.8 | 69.7 | 69.8 | 18.2 |
| 19 |  Portugal |
69.8 | 68.6 | 71.0 | 18.5 |
| 22 |  Maldives |
69.6 | 69.0 | 70.5 | 17.3 |
| 23 |  Australia |
69.5 | 69.1 | 69.9 | 18.5 |
| 23 |  Kuwait |
69.5 | 69.7 | 68.8 | 17.9 |
| 25 |  Finland |
69.4 | 68.0 | 70.7 | 17.7 |
| 26 |  Qatar |
69.3 | 69.8 | 67.8 | 16.8 |
| 27 |  Slovenia |
69.2 | 67.7 | 70.7 | 17.0 |
| 28 |  Germany |
69.1 | 68.4 | 69.8 | 17.4 |
| 29 |  Chile |
69.0 | 68.4 | 69.5 | 18.4 |
| 30 |  Netherlands |
68.8 | 69.1 | 68.6 | 17.6 |
| 31 |  Bahrain |
68.7 | 71.3 | 64.9 | 17.4 |
| 32 |  Jordan |
68.6 | 69.0 | 68.1 | 17.7 |
| 33 |  Albania |
68.3 | 67.0 | 69.6 | 16.9 |
| 34 |  Oman |
68.2 | 68.1 | 67.9 | 16.9 |
| 34 |  United Kingdom |
68.2 | 67.9 | 68.4 | 17.5 |
| 36 |  China |
68.0 | 66.2 | 69.9 | 16.2 |
| 36 |  Czech Republic |
68.0 | 66.4 | 69.5 | 16.2 |
| 36 |  New Zealand |
68.0 | 68.0 | 68.0 | 17.1 |
| 39 |  Canada |
67.9 | 67.5 | 68.4 | 17.6 |
| 40 |  Estonia |
67.8 | 65.2 | 70.0 | 16.7 |
| 40 |  Thailand |
67.8 | 65.4 | 70.3 | 18.3 |
| 42 |  Barbados |
67.4 | 66.4 | 68.3 | 17.0 |
| 43 |  Croatia |
67.3 | 65.3 | 69.3 | 15.8 |
| 43 |  Panama |
67.3 | 66.2 | 68.5 | 17.5 |
| 45 |  Bosnia |
67.2 | 65.8 | 68.5 | 15.8 |
| 46 |  Costa Rica |
67.1 | 65.8 | 68.3 | 17.6 |
| 46 |  Peru |
67.1 | 66.8 | 67.5 | 17.2 |
| 46 |  Slovakia |
67.1 | 65.1 | 69.1 | 15.9 |
| 49 |  Poland |
66.9 | 64.6 | 69.1 | 15.8 |
| 50 |  Antigua |
66.7 | 65.3 | 67.9 | 16.3 |
| 50 |  Brunei |
66.7 | 66.0 | 67.4 | 15.8 |
| 50 |  Colombia |
66.7 | 65.5 | 67.9 | 17.0 |
| 53 |  Sri Lanka |
66.6 | 64.3 | 68.9 | 15.5 |
| 54 |  Algeria |
66.5 | 66.5 | 66.5 | 16.6 |
| 54 |  Ecuador |
66.5 | 64.6 | 68.4 | 17.5 |
| 54 |  North Macedonia |
66.5 | 65.4 | 67.6 | 14.9 |
| 54 |  Saudi Arabia |
66.5 | 66.8 | 65.8 | 15.8 |
| 58 |  Argentina |
66.4 | 65.3 | 67.4 | 16.4 |
| 58 |  Armenia |
66.4 | 63.9 | 68.5 | 15.5 |
| 60 |  Cuba |
66.2 | 65.0 | 67.3 | 15.6 |
| 60 |  Tunisia |
66.2 | 65.4 | 66.9 | 15.8 |
| 60 |  Uruguay |
66.2 | 64.4 | 67.8 | 16.5 |
| 63 |  Lithuania |
66.1 | 63.3 | 68.7 | 15.8 |
| 63 |  Seychelles |
66.1 | 64.0 | 68.6 | 16.0 |
| 65 |  Hungary |
66.0 | 64.1 | 67.7 | 14.7 |
| 65 |  Lebanon |
66.0 | 65.2 | 66.8 | 16.6 |
| 65 |  Romania |
66.0 | 63.5 | 68.6 | 15.4 |
| 65 |  Serbia |
66.0 | 64.6 | 67.4 | 14.8 |
| 69 |  Cape Verde |
65.9 | 63.3 | 68.5 | 16.3 |
| 70 |  Iran |
65.6 | 65.0 | 66.2 | 15.9 |
| 71 |  Malaysia |
65.5 | 64.4 | 66.8 | 14.9 |
| 71 |  Vietnam |
65.5 | 62.7 | 68.3 | 15.4 |
| 73 |  Bulgaria |
65.4 | 63.0 | 67.9 | 14.9 |
| 73 |  Nicaragua |
65.4 | 64.0 | 66.6 | 16.1 |
| 75 |  Azerbaijan |
65.2 | 63.5 | 66.8 | 15.3 |
| 75 |  Latvia |
65.2 | 62.1 | 68.2 | 15.2 |
| 77 |  Kyrgyzstan |
65.1 | 63.6 | 66.6 | 15.0 |
| 77 |  Turkey |
65.1 | 65.1 | 65.1 | 16.3 |
| 79 |  Bhutan |
65.0 | 65.1 | 64.9 | 15.4 |
| 79 |  Montenegro |
65.0 | 62.9 | 67.1 | 14.0 |
| 81 |  Belarus |
64.6 | 61.3 | 67.6 | 14.6 |
| 81 |  Georgia |
64.6 | 61.2 | 67.7 | 14.7 |
| 81 |  Kazakhstan |
64.6 | 61.9 | 67.1 | 14.9 |
| 81 |  Morocco |
64.6 | 65.2 | 64.0 | 15.4 |
| 81 |  Tajikistan |
64.6 | 64.0 | 65.2 | 14.6 |
| 81 |  United States |
64.6 | 63.8 | 65.4 | 15.8 |
| 81 |  Uzbekistan |
64.6 | 63.7 | 65.5 | 14.3 |
| 88 |  Mongolia |
64.1 | 60.8 | 67.3 | 15.5 |
| 89 |  Dominican Republic |
64.0 | 61.7 | 66.5 | 17.0 |
| 90 |  Bahamas |
63.8 | 62.2 | 65.3 | 16.4 |
| 90 |  Brazil |
63.8 | 62.6 | 65.1 | 15.7 |
| 90 |  Samoa |
63.8 | 62.6 | 65.1 | 14.8 |
| 93 |  Indonesia |
63.7 | 62.1 | 65.3 | 14.6 |
| 94 |  Mauritius |
63.6 | 61.7 | 65.6 | 14.9 |
| 95 |  Sao Tome |
63.3 | 63.0 | 63.5 | 14.3 |
| 95 |  Tonga |
63.3 | 62.2 | 64.3 | 13.7 |
| 97 |  Mexico |
63.1 | 61.6 | 64.6 | 15.1 |
| 98 |  North Korea |
63.0 | 61.1 | 65.1 | 14.3 |
| 99 |  Bolivia |
62.8 | 62.1 | 63.5 | 14.2 |
| 100 |  El Salvador |
62.7 | 59.2 | 66.0 | 15.2 |
| 100 |  Grenada |
62.7 | 61.3 | 64.3 | 14.5 |
| 100 |  Jamaica |
62.7 | 61.6 | 63.8 | 14.1 |
| 103 |  Paraguay |
62.5 | 60.9 | 64.3 | 14.2 |
| 104 |  Bangladesh |
62.4 | 62.3 | 62.6 | 14.4 |
| 104 |  Iraq |
62.4 | 61.4 | 63.3 | 14.5 |
| 106 |  Cambodia |
62.3 | 60.8 | 63.7 | 14.0 |
| 106 |  Moldova |
62.3 | 59.5 | 64.9 | 13.5 |
| 108 |  Russia |
62.2 | 58.1 | 66.4 | 14.9 |
| 109 |  Nepal |
62.1 | 61.5 | 62.8 | 13.8 |
| 110 |  Philippines |
62.0 | 59.8 | 64.4 | 13.5 |
| 111 |  Honduras |
61.9 | 61.9 | 61.9 | 14.0 |
| 111 |  Saint Lucia |
61.9 | 59.1 | 65.1 | 14.4 |
| 113 |  Laos |
61.8 | 60.5 | 63.1 | 13.7 |
| 113 |  Venezuela |
61.8 | 59.4 | 64.2 | 14.6 |
| 115 |  Belize |
61.7 | 60.6 | 63.0 | 13.8 |
| 116 |  Egypt |
61.6 | 61.0 | 62.2 | 12.5 |
| 116 |  Ukraine |
61.6 | 57.6 | 65.8 | 14.5 |
| 118 |  Mauritania |
61.4 | 61.9 | 61.1 | 14.2 |
| 118 |  Saint Vincent |
61.4 | 59.5 | 63.5 | 14.1 |
| 120 |  Syria |
61.3 | 60.4 | 62.3 | 14.3 |
| 121 |  Suriname |
61.2 | 59.8 | 62.6 | 14.0 |
| 122 |  East Timor |
60.8 | 60.0 | 61.8 | 14.0 |
| 123 |  Comoros |
60.7 | 60.2 | 61.1 | 13.7 |
| 124 |  India |
60.6 | 60.4 | 60.9 | 13.7 |
| 124 |  Myanmar |
60.6 | 58.2 | 63.2 | 13.9 |
| 126 |  Guatemala |
60.5 | 59.0 | 61.9 | 13.8 |
| 126 |  Turkmenistan |
60.5 | 57.8 | 62.9 | 13.2 |
| 128 |  Rwanda |
60.0 | 58.8 | 61.0 | 13.6 |
| 129 |  Trinidad |
59.8 | 57.4 | 62.5 | 12.9 |
| 130 |  Ethiopia |
59.6 | 58.7 | 60.4 | 13.9 |
| 131 |  Senegal |
59.4 | 58.9 | 59.9 | 13.1 |
| 132 |  Fiji |
59.3 | 57.9 | 60.7 | 12.2 |
| 133 |  Tanzania |
59.2 | 58.6 | 59.8 | 13.5 |
| 134 |  Vanuatu |
59.1 | 56.9 | 61.7 | 12.3 |
| 135 |  Papua New Guinea |
59.0 | 58.3 | 59.8 | 13.4 |
| 136 |  Kenya |
58.9 | 57.3 | 60.7 | 13.3 |
| 136 |  Libya |
58.9 | 59.4 | 58.3 | 13.7 |
| 138 |  Ghana |
58.7 | 57.5 | 60.1 | 13.1 |
| 139 |  Djibouti |
58.4 | 57.6 | 59.1 | 13.5 |
| 139 |  Pakistan |
58.4 | 58.4 | 58.4 | 13.1 |
| 141 |  Botswana |
58.1 | 57.0 | 59.2 | 14.5 |
| 141 |  Uganda |
58.1 | 56.3 | 59.8 | 13.4 |
| 143 |  Yemen |
57.9 | 57.5 | 58.3 | 13.1 |
| 144 |  Sudan |
57.8 | 57.3 | 58.4 | 13.7 |
| 145 |  Gabon |
57.7 | 56.4 | 59.3 | 12.7 |
| 146 |  Gambia |
57.6 | 56.7 | 58.5 | 13.0 |
| 147 |  Solomon Islands |
57.4 | 55.8 | 59.3 | 11.6 |
| 148 |  Namibia |
56.9 | 54.6 | 59.2 | 12.6 |
| 149 |  Burundi |
56.8 | 55.6 | 58.0 | 13.1 |
| 150 |  Benin |
56.4 | 55.3 | 57.5 | 13.1 |
| 150 |  Eritrea |
56.4 | 54.5 | 58.3 | 12.2 |
| 150 |  Ivory Coast |
56.4 | 55.4 | 57.5 | 13.0 |
| 150 |  Madagascar |
56.4 | 56.0 | 56.8 | 13.0 |
| 154 |  South Africa |
56.2 | 53.9 | 58.6 | 13.4 |
| 154 |  Zambia |
56.2 | 54.8 | 57.5 | 12.8 |
| 156 |  Malawi |
56.0 | 54.4 | 57.5 | 12.4 |
| 157 |  Congo |
55.9 | 56.0 | 55.9 | 12.4 |
| 158 |  Cameroon |
55.8 | 54.8 | 56.7 | 12.8 |
| 158 |  Togo |
55.8 | 54.5 | 57.1 | 12.7 |
| 160 |  Angola |
55.7 | 54.6 | 56.8 | 12.3 |
| 161 |  Burkina Faso |
55.5 | 54.0 | 57.0 | 13.0 |
| 162 |  Haiti |
55.2 | 55.2 | 55.3 | 12.2 |
| 162 |  Mali |
55.2 | 55.3 | 55.1 | 12.9 |
| 164 |  Equatorial Guinea |
55.0 | 54.8 | 55.3 | 12.7 |
| 165 |  Kiribati |
54.5 | 52.2 | 56.9 | 10.4 |
| 166 |  Palestine |
54.3 | 51.8 | 56.9 | 15.6 |
| 167 |  Guinea |
54.2 | 53.8 | 54.7 | 12.7 |
| 167 |  Liberia |
54.2 | 54.0 | 54.4 | 12.5 |
| 169 |  Nigeria |
54.1 | 53.7 | 54.4 | 13.2 |
| 170 |  Sierra Leone |
53.6 | 53.6 | 53.5 | 12.7 |
| 171 |  Afghanistan |
53.3 | 54.0 | 52.8 | 11.1 |
| 172 |  DR Congo |
53.1 | 51.8 | 54.5 | 12.0 |
| 172 |  Niger |
53.1 | 52.8 | 53.4 | 12.7 |
| 174 |  Chad |
52.8 | 52.0 | 53.6 | 12.1 |
| 174 |  Guinea-Bissau |
52.8 | 51.4 | 54.1 | 11.5 |
| 176 |  Mozambique |
52.7 | 50.9 | 54.2 | 11.8 |
| 176 |  South Sudan |
52.7 | 51.5 | 53.9 | 12.5 |
| 178 |  Guyana |
52.6 | 50.1 | 55.3 | 9.5 |
| 179 |  Zimbabwe |
52.5 | 50.9 | 54.0 | 11.4 |
| 180 |  Eswatini |
51.1 | 49.5 | 52.7 | 11.2 |
| 181 |  Somalia |
48.6 | 46.9 | 50.4 | 10.2 |
| 182 |  Lesotho |
47.9 | 45.8 | 50.3 | 9.7 |
| 183 |  CAR |
44.7 | 42.3 | 47.1 | 8.6 |
Healthy life expectancy at birth ranges from 72.9 years in Singapore to 44.7 in the Central African Republic. The world average was 63.1 years: 62.0 for men and 64.2 for women; people aged 60 could expect another 14.9 years in good health.
Healthy life expectancy (HALE), a measure of healthspan, is the average number of years a newborn would live in full health, counting the years lived with illness or disability at the rates of the year as partly lost. HALE at 60 is the number of healthy years still ahead of people aged 60. The figures are estimates of the World Health Organization; the world average is computed from the countries' figures.
Healthy life expectancy map
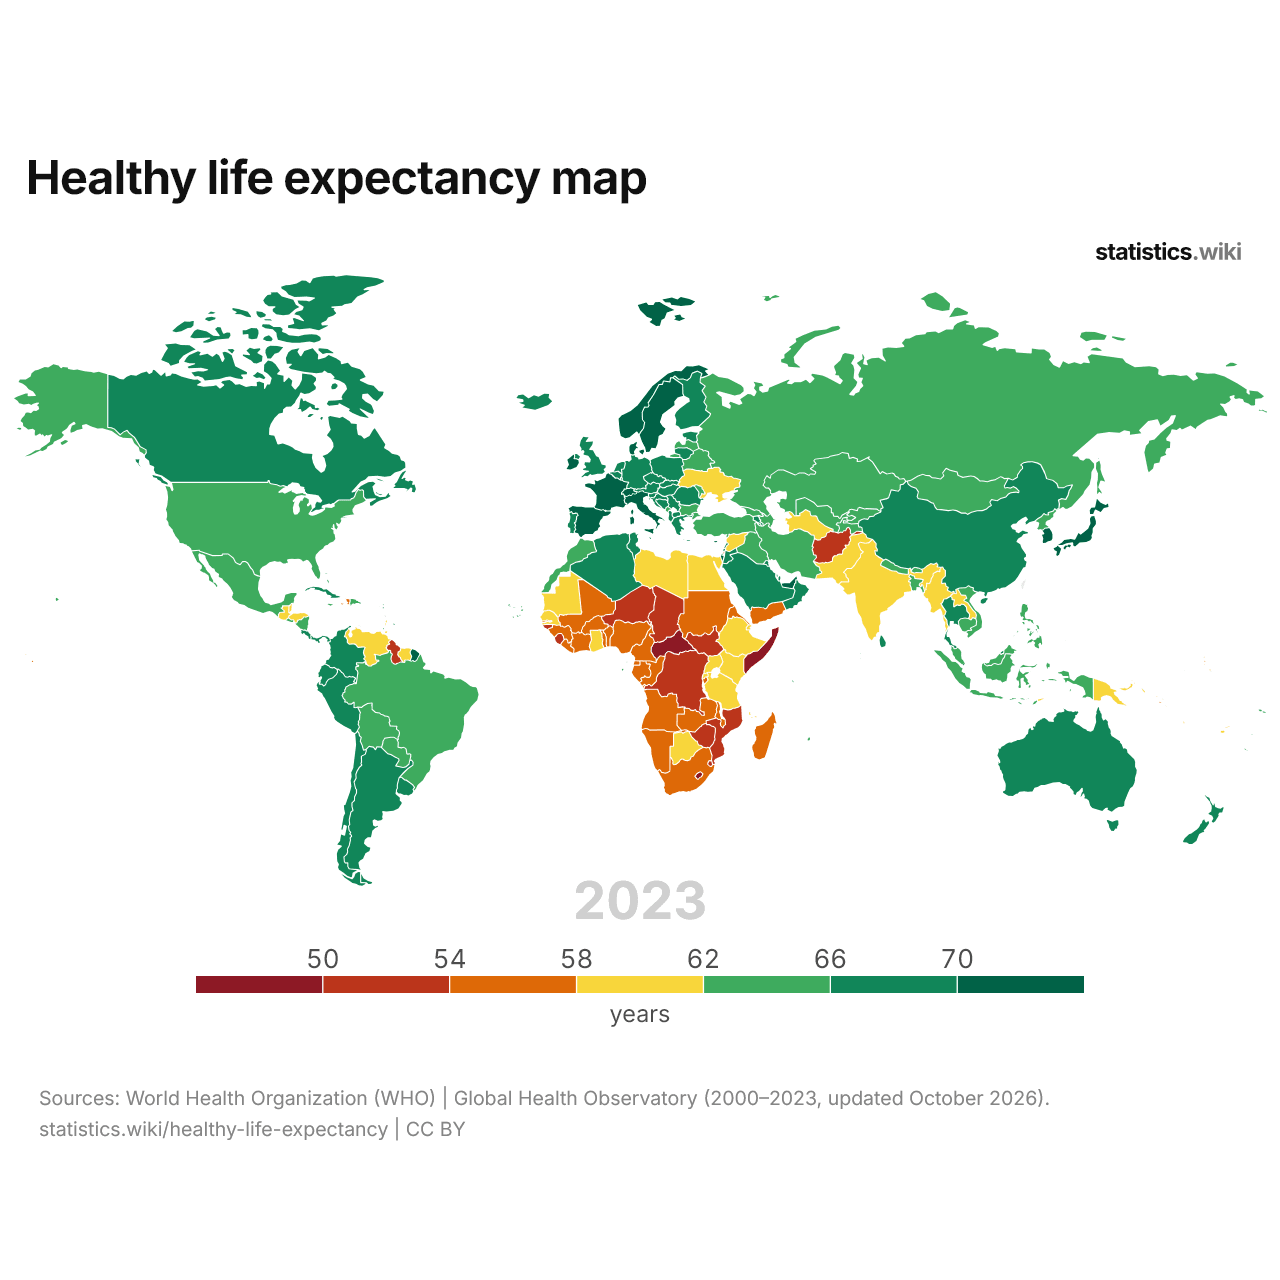
Healthy life expectancy at birth is below 54 years in 14 countries and above 70 in 15; in 2000, it was below 54 in 54 and above 70 in one.
Healthy life expectancy in the 5 most populous countries
| Year | Healthy life expectancy, years | ||||
|---|---|---|---|---|---|
| China | United States | Indonesia | India | Pakistan | |
| 2023 | 68 | 64.6 | 63.7 | 60.6 | 58.4 |
| 2022 | 68.2 | 64 | 62.4 | 60.2 | 57.5 |
| 2021 | 68.5 | 63.2 | 58.9 | 58.4 | 56.4 |
| 2020 | 68.6 | 63.8 | 62.3 | 60.1 | 56.6 |
| 2019 | 68.4 | 65.3 | 63.4 | 60.5 | 57.6 |
| 2018 | 68.2 | 65.3 | 63.1 | 60.2 | 57.3 |
| 2017 | 68 | 65.2 | 62.9 | 59.8 | 57 |
| 2016 | 67.8 | 65.3 | 62.6 | 59.5 | 56.8 |
| 2015 | 67.6 | 65.4 | 62.4 | 59.1 | 56.5 |
| 2014 | 67.5 | 65.5 | 62.2 | 58.9 | 56.2 |
| 2013 | 67.3 | 65.6 | 61.9 | 58.5 | 56 |
| 2012 | 67 | 65.7 | 61.7 | 58.1 | 55.7 |
| 2011 | 66.8 | 65.6 | 61.5 | 57.8 | 55.5 |
| 2010 | 66.6 | 65.7 | 61.2 | 57.4 | 55.2 |
| 2009 | 66.4 | 65.5 | 61 | 57.1 | 55 |
| 2008 | 65.9 | 65.3 | 60.8 | 56.9 | 54.8 |
| 2007 | 65.7 | 65.2 | 60.5 | 56.5 | 54.5 |
| 2006 | 65.4 | 65.1 | 60.3 | 56.2 | 54.3 |
| 2005 | 64.9 | 64.9 | 60.1 | 55.9 | 53.4 |
| 2004 | 64.4 | 64.9 | 58.3 | 55.6 | 53.8 |
| 2003 | 64.2 | 64.7 | 59.6 | 55.1 | 53.6 |
| 2002 | 63.9 | 64.6 | 59.4 | 54.7 | 53.4 |
| 2001 | 63.5 | 64.5 | 59.3 | 54.2 | 53.2 |
| 2000 | 63.2 | 64.5 | 59 | 53.8 | 53 |
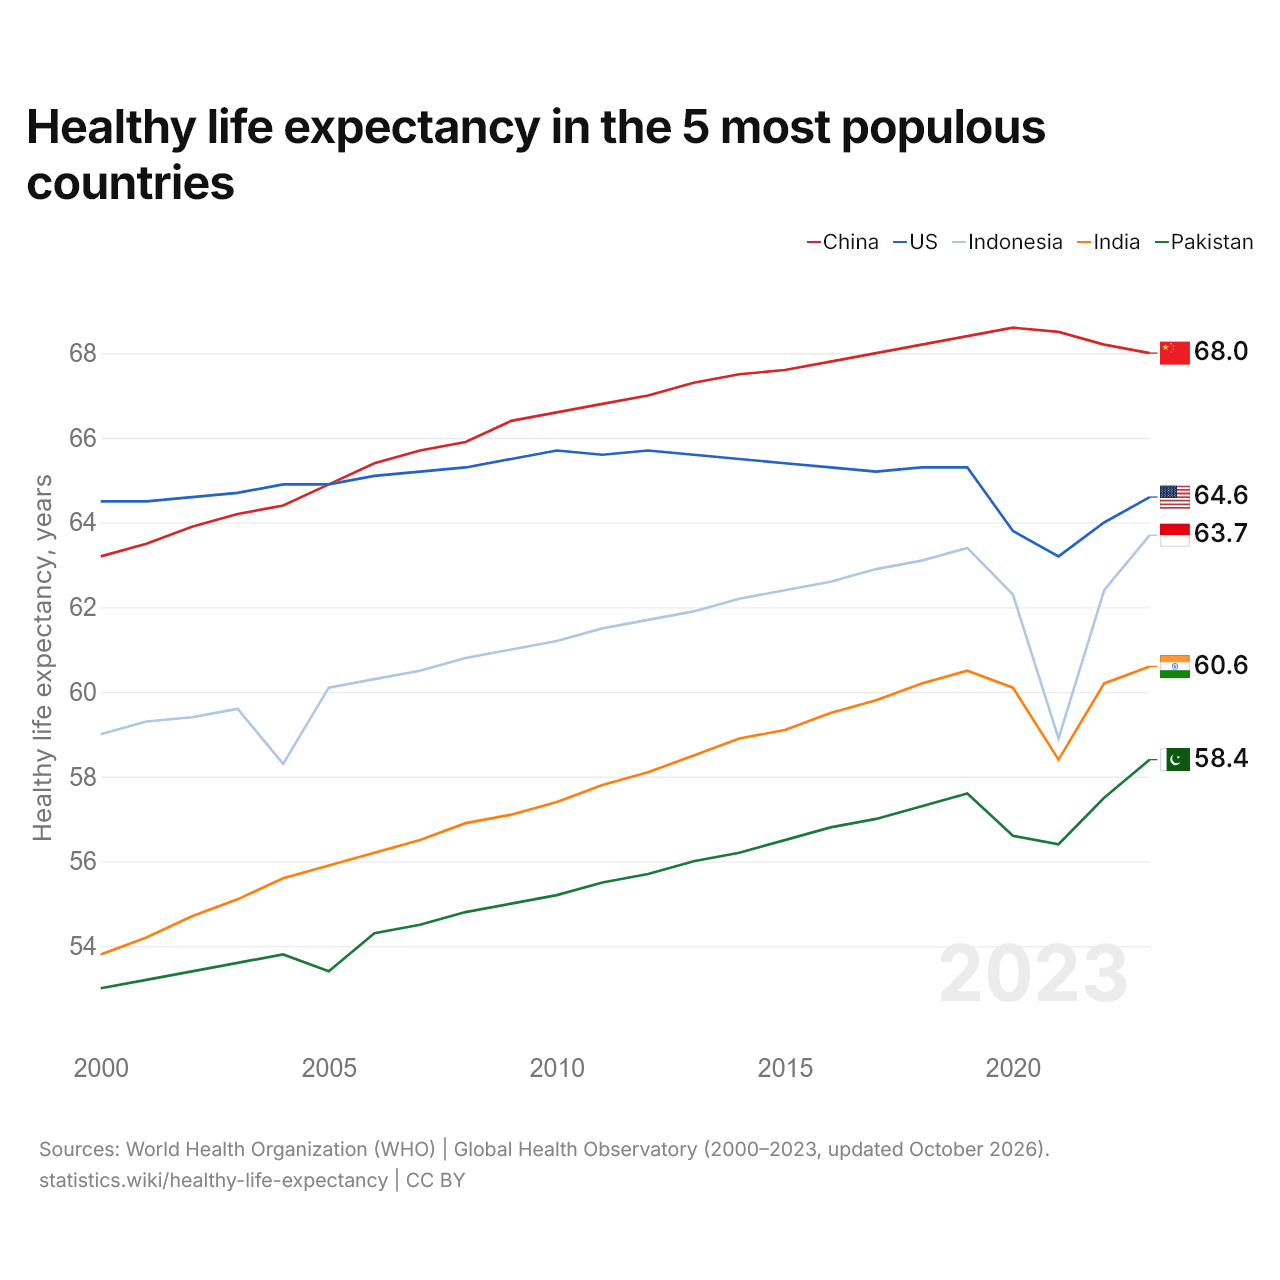
Among the five most populous countries, healthy life expectancy at birth is highest in China, at 68.0 years, and lowest in Pakistan, at 58.4. The gap between the highest and the lowest has narrowed from 11.5 years in 2000 to 9.6.
Compare the healthy life expectancy of any 2 countries
Sources:
- World Health Organization (WHO) | Global Health Observatory (2000–2023, updated October 2026)
Creative Commons Attribution (CC BY): you may copy, share, adapt and reuse this content, also commercially, as long as you credit statistics.wiki and note any changes you made. The sources listed above may have their own license terms.