
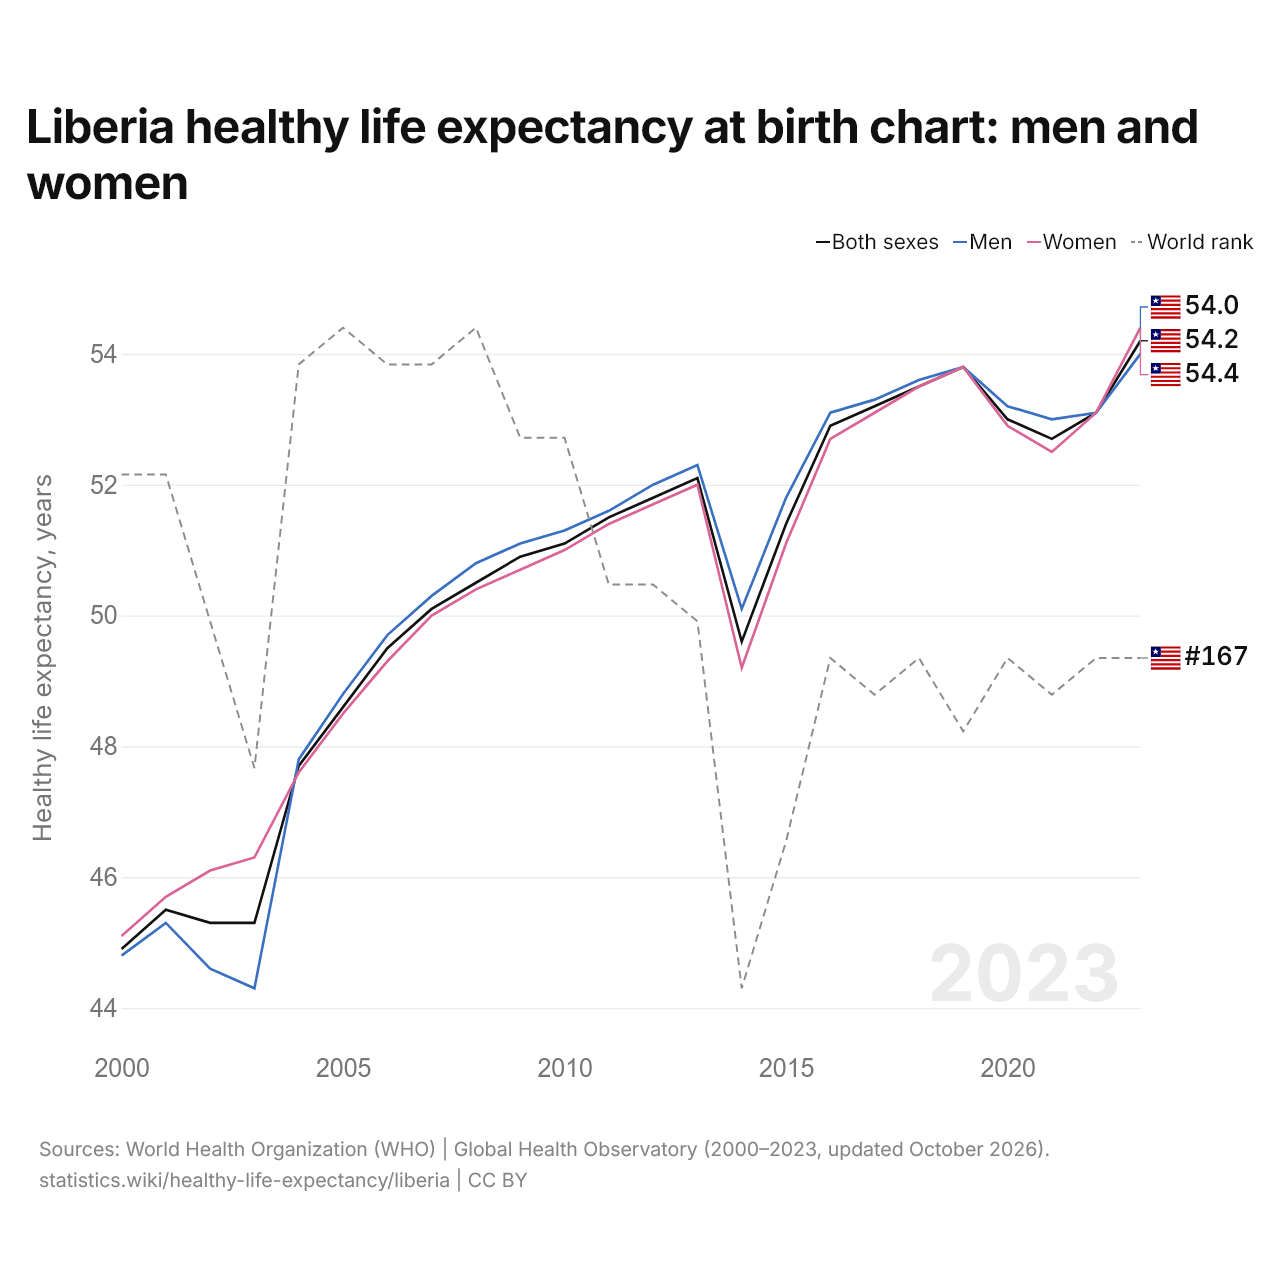
Liberia healthy life expectancy at birth chart: men and women
| Year | Healthy life expectancy, years | World rank | ||
|---|---|---|---|---|
| Both sexes | Men | Women | ||
| 2023 | 54.2 | 54 | 54.4 | #167 |
| 2022 | 53.1 | 53.1 | 53.1 | #167 |
| 2021 | 52.7 | 53 | 52.5 | #168 |
| 2020 | 53 | 53.2 | 52.9 | #167 |
| 2019 | 53.8 | 53.8 | 53.8 | #169 |
| 2018 | 53.5 | 53.6 | 53.5 | #167 |
| 2017 | 53.2 | 53.3 | 53.1 | #168 |
| 2016 | 52.9 | 53.1 | 52.7 | #167 |
| 2015 | 51.4 | 51.8 | 51.1 | #172 |
| 2014 | 49.6 | 50.1 | 49.2 | #176 |
| 2013 | 52.1 | 52.3 | 52 | #166 |
| 2012 | 51.8 | 52 | 51.7 | #165 |
| 2011 | 51.5 | 51.6 | 51.4 | #165 |
| 2010 | 51.1 | 51.3 | 51 | #161 |
| 2009 | 50.9 | 51.1 | 50.7 | #161 |
| 2008 | 50.5 | 50.8 | 50.4 | #158 |
| 2007 | 50.1 | 50.3 | 50 | #159 |
| 2006 | 49.5 | 49.7 | 49.3 | #159 |
| 2005 | 48.6 | 48.8 | 48.5 | #158 |
| 2004 | 47.7 | 47.8 | 47.6 | #159 |
| 2003 | 45.3 | 44.3 | 46.3 | #170 |
| 2002 | 45.3 | 44.6 | 46.1 | #166 |
| 2001 | 45.5 | 45.3 | 45.7 | #162 |
| 2000 | 44.9 | 44.8 | 45.1 | #162 |
Healthy life expectancy at birth in Liberia is 54.2 years, up from 44.9 in 2000. It is the 167th highest in the world, a rank it has held since 2022. Its highest rank was 158th, last held in 2008. Men can expect 54.0 years in good health and women 54.4.
Liberia's healthy life expectancy is the 40th highest of the 54 countries of Africa, where it ranges from the Central African Republic's 44.7 years to Algeria's 66.5. In 2000, women's healthy life expectancy in Liberia was 0.3 years longer than men's; the gap was widest in 2003, at 2.0 years.
Liberia healthy life expectancy at birth and at 60
| At birth | At 60 | |
|---|---|---|
| Both sexes | 54.2 | 12.5 |
| Men | 54.0 | 12.4 |
| Women | 54.4 | 12.6 |
Liberia in the world healthy life expectancy ranking
| Rank | Country | At birth | Men | Women | Change since 2000 | |
|---|---|---|---|---|---|---|
| 165 |
 Kiribati |
54.5 | 52.2 | 56.9 | +1.6 | |
| 166 |
 Palestine |
54.3 | 51.8 | 56.9 | −8.6 | |
| 167 |
 Guinea |
54.2 | 53.8 | 54.7 | +7.0 | vs Guinea |
| 167 |
 Liberia |
54.2 | 54.0 | 54.4 | +9.3 | |
| 169 |
 Nigeria |
54.1 | 53.7 | 54.4 | +7.4 | vs Nigeria |
| 170 |
 Sierra Leone |
53.6 | 53.6 | 53.5 | +11.1 | vs Sierra Leone |
| 171 |
 Afghanistan |
53.3 | 54.0 | 52.8 | +8.7 |
Compare Liberia healthy life expectancy with other countries
Sources:
- World Health Organization (WHO) | Global Health Observatory (2000–2023, updated October 2026)
Creative Commons Attribution (CC BY): you may copy, share, adapt and reuse this content, also commercially, as long as you credit statistics.wiki and note any changes you made. The sources listed above may have their own license terms.