
List of countries by military spending, with % of GDP and US$ per person, 2025
| Rank | Country | Military spending | % of GDP | US$ per person | Share of world |
|---|---|---|---|---|---|
 World |
$2.85T | 2.5% | $367 | ||
| 1 |  United States |
$959B | 3.1% | $2,806 | 33.6% |
| 2 |  China |
$336B | 1.7% | $239.1 | 11.8% |
| 3 |  Russia |
$192B | 7.5% | $1,339 | 6.73% |
| 4 |  Germany |
$115B | 2.3% | $1,372 | 4.01% |
| 5 |  United Kingdom |
$94.2B | 2.4% | $1,356 | 3.3% |
| 6 |  India |
$90.8B | 2.3% | $62 | 3.18% |
| 7 |  Ukraine |
$84.8B | 39.6% | $2,174 | 2.97% |
| 8 |  Saudi Arabia |
$82.8B | 6.5% | $2,239 | 2.9% |
| 9 |  France |
$68.2B | 2.0% | $993 | 2.39% |
| 10 |  Japan |
$62.6B | 1.4% | $508 | 2.19% |
| 11 |  South Korea |
$48.7B | 2.6% | $942 | 1.71% |
| 12 |  Italy |
$48.2B | 1.9% | $818 | 1.69% |
| 13 |  Israel |
$47.7B | 7.8% | $4,712 | 1.67% |
| 14 |  Poland |
$46.6B | 4.5% | $1,278 | 1.63% |
| 15 |  Spain |
$40.6B | 2.1% | $822 | 1.42% |
| 16 |  Canada |
$37.8B | 1.6% | $906 | 1.32% |
| 17 |  Australia |
$34.5B | 1.9% | $1,249 | 1.21% |
| 18 |  Turkey |
$30.5B | 1.9% | $355 | 1.07% |
| 19 |  Netherlands |
$29.2B | 2.2% | $1,617 | 1.02% |
| 20 |  Algeria |
$25.3B | 8.8% | $534 | 0.89% |
| 21 |  Brazil |
$24.0B | 1.1% | $113 | 0.84% |
| 22 |  Singapore |
$18.4B | 3.0% | $3,010 | 0.64% |
| 23 |  Norway |
$17.4B | 3.3% | $3,101 | 0.61% |
| 24 |  Sweden |
$16.5B | 2.5% | $1,560 | 0.58% |
| 25 |  Qatar |
$15.3B (2022) | 6.5% | $5,766 | 0.7% |
| 26 |  Indonesia |
$15.1B | 1.0% | $52.9 | 0.53% |
| 27 |  Denmark |
$15.0B | 3.3% | $2,504 | 0.53% |
| 28 |  Colombia |
$14.6B | 3.2% | $274.2 | 0.51% |
| 29 |  Belgium |
$14.6B | 2.0% | $1,220 | 0.51% |
| 30 |  Mexico |
$13.5B | 0.7% | $102.3 | 0.47% |
| 31 |  Pakistan |
$11.9B | 2.9% | $46.5 | 0.42% |
| 32 |  Vietnam |
$11.1B | 2.2% | $109.1 | 0.39% |
| 33 |  Romania |
$9.78B | 2.3% | $514 | 0.34% |
| 34 |  Greece |
$8.39B | 3.0% | $805 | 0.29% |
| 35 |  Finland |
$8.15B | 2.6% | $1,444 | 0.29% |
| 36 |  Switzerland |
$7.90B | 0.8% | $869 | 0.28% |
| 37 |  Iran |
$7.59B | 2.1% | $82.1 | 0.27% |
| 38 |  Kuwait |
$7.37B | 4.7% | $1,515 | 0.26% |
| 39 |  Czech Republic |
$7.18B | 1.8% | $659 | 0.25% |
| 40 |  Morocco |
$6.46B | 3.5% | $168.1 | 0.23% |
| 41 |  Austria |
$6.38B | 1.1% | $693 | 0.22% |
| 42 |  Philippines |
$6.31B | 1.3% | $54 | 0.22% |
| 43 |  Oman |
$6.23B | 5.7% | $1,133 | 0.22% |
| 44 |  Iraq |
$6.23B | 2.4% | $132.4 | 0.22% |
| 45 |  Thailand |
$5.99B | 1.0% | $83.6 | 0.21% |
| 46 |  Portugal |
$5.93B | 1.7% | $549 | 0.21% |
| 47 |  Chile |
$5.43B | 1.5% | $273.6 | 0.19% |
| 48 |  Hungary |
$5.02B | 2.0% | $528 | 0.18% |
| 49 |  Azerbaijan |
$4.91B | 6.5% | $479 | 0.17% |
| 50 |  Myanmar |
$4.89B (2024) | 6.6% | $89.8 | 0.18% |
| 51 |  Malaysia |
$4.89B | 1.0% | $136 | 0.17% |
| 52 |  Argentina |
$3.85B | 0.6% | $83.9 | 0.13% |
| 53 |  Bangladesh |
$3.70B | 0.8% | $21.1 | 0.13% |
| 54 |  South Africa |
$3.15B | 0.7% | $48.6 | 0.11% |
| 55 |  Slovakia |
$3.14B | 2.0% | $580 | 0.11% |
| 56 |  Lithuania |
$2.93B | 3.1% | $1,015 | 0.1% |
| 57 |  New Zealand |
$2.91B | 1.1% | $547 | 0.1% |
| 58 |  Jordan |
$2.81B | 4.6% | $243.7 | 0.1% |
| 59 |  Serbia |
$2.75B | 2.8% | $421 | 0.1% |
| 60 |  Ecuador |
$2.73B | 2.1% | $149.3 | 0.1% |
| 61 |  Peru |
$2.72B | 0.8% | $78.7 | 0.1% |
| 62 |  Nigeria |
$2.64B | 0.9% | $11.1 | 0.09% |
| 63 |  Bulgaria |
$2.62B | 2.0% | $408 | 0.09% |
| 64 |  Belarus |
$2.24B | 2.4% | $246.4 | 0.08% |
| 65 |  Egypt |
$2.21B | 0.6% | $18.7 | 0.08% |
| 66 |  Croatia |
$2.12B | 2.0% | $547 | 0.07% |
| 67 |  Uruguay |
$1.95B | 2.3% | $576 | 0.07% |
| 68 |  Armenia |
$1.78B | 6.1% | $577 | 0.06% |
| 69 |  Latvia |
$1.75B | 3.6% | $949 | 0.06% |
| 70 |  Angola |
$1.71B | 1.4% | $43.7 | 0.06% |
| 71 |  Estonia |
$1.59B | 3.4% | $1,161 | 0.06% |
| 72 |  Ireland |
$1.58B | 0.2% | $288.4 | 0.06% |
| 73 |  Libya |
$1.57B (2023) | 3.6% | $215.3 | 0.07% |
| 74 |  Bahrain |
$1.52B | 3.1% | $950 | 0.05% |
| 75 |  Kenya |
$1.45B | 1.1% | $25.2 | 0.05% |
| 76 |  Tunisia |
$1.43B | 2.5% | $116.2 | 0.05% |
| 77 |  Sri Lanka |
$1.43B | 1.3% | $65.6 | 0.05% |
| 78 |  Kazakhstan |
$1.32B | 0.4% | $63.2 | 0.05% |
| 79 |  DR Congo |
$1.25B | 1.4% | $11.1 | 0.04% |
| 80 |  Slovenia |
$1.23B | 1.5% | $577 | 0.04% |
| 81 |  Uganda |
$1.21B | 2.0% | $23.6 | 0.04% |
| 82 |  Mali |
$1.16B | 3.9% | $46.2 | 0.04% |
| 83 |  Tanzania |
$1.04B | 1.2% | $14.8 | 0.04% |
| 84 |  Dominican Republic |
$1.02B | 0.8% | $88.7 | 0.04% |
| 85 |  Burkina Faso |
$912M | 3.3% | $37.9 | 0.03% |
| 86 |  Luxembourg |
$861M | 0.9% | $1,253 | 0.03% |
| 87 |  Bolivia |
$787M | 1.2% | $62.5 | 0.03% |
| 88 |  Ivory Coast |
$773M | 0.8% | $23.6 | 0.03% |
| 89 |  Cambodia |
$743M | 1.5% | $41.7 | 0.03% |
| 90 |  Chad |
$684M | 3.2% | $32.6 | 0.02% |
| 91 |  Georgia |
$666M | 1.7% | $169.2 | 0.02% |
| 92 |  Cyprus |
$662M | 1.6% | $483 | 0.02% |
| 93 |  Kyrgyzstan |
$660M | 2.9% | $89.9 | 0.02% |
| 94 |  Guatemala |
$645M | 0.5% | $34.5 | 0.02% |
| 95 |  Ethiopia |
$624M | 0.5% | $4.61 | 0.02% |
| 96 |  Cameroon |
$624M | 1.1% | $20.9 | 0.02% |
| 97 |  Albania |
$621M | 2.0% | $264.2 | 0.02% |
| 98 |  Botswana |
$619M | 3.1% | $241.7 | 0.02% |
| 99 |  Lebanon |
$585M (2024) | 2.3% | $100.7 | 0.02% |
| 100 |  Honduras |
$580M | 1.5% | $52.7 | 0.02% |
| 101 |  Senegal |
$576M | 1.6% | $30.4 | 0.02% |
| 102 |  Guinea |
$575M | 2.0% | $38.1 | 0.02% |
| 103 |  Brunei |
$560M (2024) | 3.7% | $1,211 | 0.02% |
| 104 |  Ghana |
$545M | 0.5% | $15.5 | 0.02% |
| 105 |  Venezuela |
$513M (2023) | 0.5% | $18.1 | 0.02% |
| 106 |  El Salvador |
$492M | 1.3% | $77.2 | 0.02% |
| 107 |  Niger |
$462M | 2.1% | $16.6 | 0.02% |
| 108 |  Nepal |
$439M | 1.0% | $14.8 | 0.02% |
| 109 |  Paraguay |
$431M | 0.9% | $61.5 | 0.02% |
| 110 |  Namibia |
$417M | 2.8% | $134.9 | 0.01% |
| 111 |  Mozambique |
$417M | 1.9% | $11.7 | 0.01% |
| 112 |  North Macedonia |
$376M | 2.0% | $206.3 | 0.01% |
| 113 |  Zambia |
$364M | 1.3% | $16.6 | 0.01% |
| 114 |  Gabon |
$356M | 1.7% | $137.3 | 0.01% |
| 115 |  Mauritania |
$321M | 2.7% | $60.4 | 0.01% |
| 116 |  Sudan |
$317M (2021) | 0.9% | $6.59 | 0.02% |
| 117 |  Jamaica |
$311M | 1.4% | $109.5 | 0.01% |
| 118 |  Zimbabwe |
$289M | 0.6% | $17.1 | 0.01% |
| 119 |  Guyana |
$269M | 1.0% | $321 | 0.009% |
| 120 |  Afghanistan |
$261M (2021) | 1.8% | $6.52 | 0.01% |
| 121 |  Tajikistan |
$260M | 1.5% | $24.1 | 0.009% |
| 122 |  Trinidad |
$244M | 0.9% | $178.2 | 0.009% |
| 123 |  Bosnia |
$237M | 0.7% | $75.6 | 0.008% |
| 124 |  Mongolia |
$224M | 0.9% | $62.7 | 0.008% |
| 125 |  Togo |
$223M | 1.9% | $25.9 | 0.008% |
| 126 |  Benin |
$219M | 0.9% | $14.8 | 0.008% |
| 127 |  Congo |
$213M | 1.3% | $32.9 | 0.007% |
| 128 |  Rwanda |
$211M | 1.3% | $14.5 | 0.007% |
| 129 |  Somalia |
$200M | 1.5% | $10.2 | 0.007% |
| 130 |  Montenegro |
$174M | 1.9% | $280 | 0.006% |
| 131 |  Malawi |
$171M | 1.1% | $7.69 | 0.006% |
| 132 |  Nicaragua |
$126M | 0.6% | $17.9 | 0.004% |
| 133 |  Malta |
$125M | 0.4% | $215 | 0.004% |
| 134 |  Madagascar |
$121M | 0.6% | $3.71 | 0.004% |
| 135 |  Equatorial Guinea |
$115M | 0.9% | $59.4 | 0.004% |
| 136 |  Moldova |
$114M | 0.6% | $48.3 | 0.004% |
| 137 |  Papua New Guinea |
$114M | 0.4% | $10.6 | 0.004% |
| 138 |  Burundi |
$109M | 3.2% | $7.58 | 0.004% |
| 139 |  Eswatini |
$82.7M | 1.6% | $65.8 | 0.003% |
| 140 |  Fiji |
$82.4M | 1.3% | $88.3 | 0.003% |
| 141 |  CAR |
$71.5M | 2.3% | $13 | 0.003% |
| 142 |  Liberia |
$44.8M | 0.9% | $7.81 | 0.002% |
| 143 |  East Timor |
$42.9M | 2.3% | $30.2 | 0.002% |
| 144 |  Lesotho |
$41.9M | 1.6% | $17.7 | 0.001% |
| 145 |  Haiti |
$38.9M | 0.1% | $3.26 | 0.001% |
| 146 |  Belize |
$33.1M | 1.0% | $78.3 | 0.001% |
| 147 |  Seychelles |
$29.7M | 1.2% | $242 | 0.001% |
| 148 |  Sierra Leone |
$27.6M | 0.4% | $3.13 | <0.001% |
| 149 |  Mauritius |
$23.5M | 0.1% | $18.9 | <0.001% |
| 150 |  Guinea-Bissau |
$22.4M | 0.9% | $9.97 | <0.001% |
| 151 |  Cape Verde |
$20.1M | 0.7% | $38.1 | <0.001% |
| 152 |  Gambia |
$14.8M | 0.6% | $5.24 | <0.001% |
| 153 |  Costa Rica |
$0 | 0.0% | $0 | 0% |
| 153 |  Iceland |
$0 | 0.0% | $0 | 0% |
| Not ranked: latest data before 2020 | |||||
 UAE |
$24.0B (2014) | 5.6% | $2,976 | 1.37% | |
 Cuba |
$2.88B (2018) | 2.9% | $256.3 | 0.16% | |
 Syria |
$2.49B (2010) | 4.1% | $110.8 | 0.15% | |
 Yemen |
$1.71B (2014) | 4.0% | $56.7 | 0.1% | |
 Uzbekistan |
$1.53B (2018) | 2.5% | $47.2 | 0.09% | |
 South Sudan |
$1.03B (2015) | 8.6% | $92.9 | 0.06% | |
 Eritrea |
$182M (2003) | 20.9% | $72.8 | 0.02% | |
 Panama |
$114M (1999) | 1.0% | $38.5 | 0.02% | |
 Turkmenistan |
$76.3M (1999) | 3.1% | $17 | 0.01% | |
 Djibouti |
$26.3M (2008) | 2.6% | $29.4 | 0.002% | |
 Laos |
$22.8M (2013) | 0.2% | $3.44 | 0.001% | |
The list ranks 154 countries by their latest military spending, from the United States ($959 billion) to the Gambia ($14.8 million). Of these, 2 reported none. The world's military spending was $2.85 trillion in 2025. Half of the countries spent less than $1.37 billion.
Military spending is what a country's government spends in a year on its armed forces: their personnel, pay and pensions, weapons and equipment, operations, military research and construction, and military aid to other countries. The share of GDP compares the spending with the size of the economy; the amounts are in current US dollars, so they also change with prices and exchange rates. The World Bank takes the figures from the Stockholm International Peace Research Institute (SIPRI), which counts military spending wherever it is in a government's accounts, so a country's figure can differ from its defense budget.
Military spending by country map
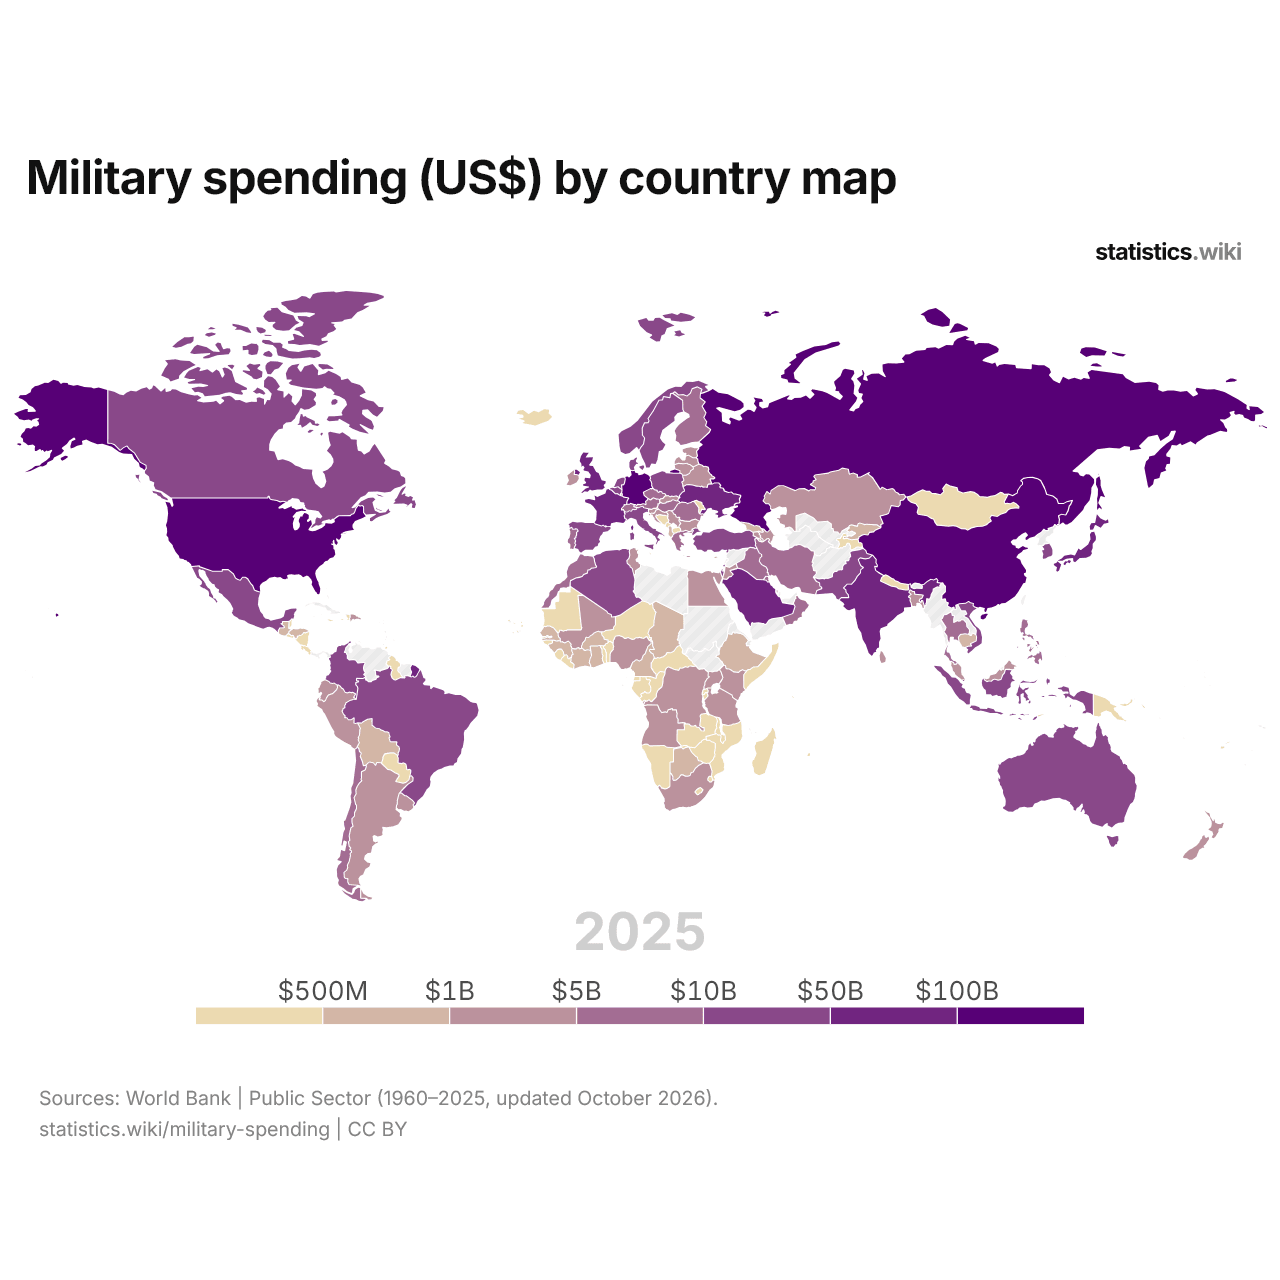
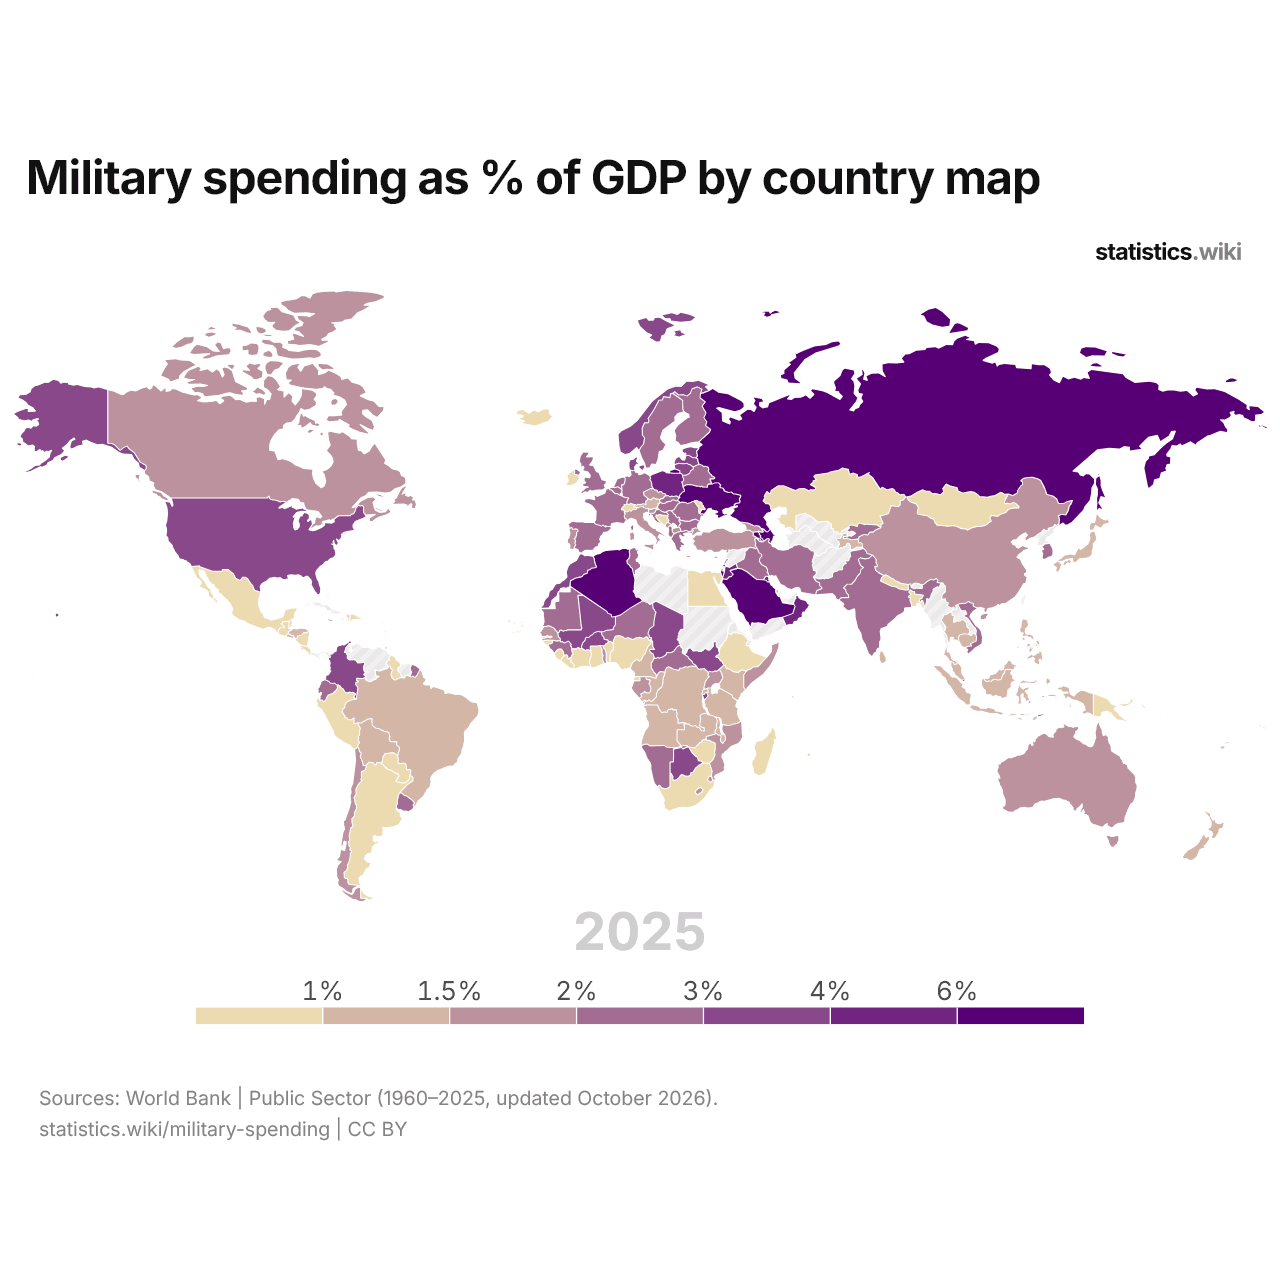
In 2025, 10 countries spent more than $50 billion on the military and 65 less than $1 billion. Military spending was more than 2% of GDP in 61 countries and less than 1% in 40; in 1992, the numbers were 77 and 20.
NATO members' military spending vs the 2% of GDP guideline, 2025
-
Poland
-
Latvia
-
Estonia
-
Norway
-
Denmark
-
United States
-
Lithuania
-
Greece
-
Finland
-
Sweden
-
United Kingdom
-
Romania
-
Germany
-
Netherlands
-
Spain
-
Hungary
-
Albania
-
Slovakia
-
France
-
Croatia
-
Belgium
-
Bulgaria
-
N. Macedonia
-
Turkey
-
Montenegro
-
Italy
-
Czech Republic
-
Portugal
-
Canada
-
Slovenia
-
Luxembourg
-
Iceland
In 2025, 23 NATO members spent at least 2% of their GDP on the military, the guideline the members agreed on, and 9 spent less. Poland's share was the highest, 4.5%, and Iceland's the lowest, 0.0%.
The 10 largest military spenders each year, 1992–2025
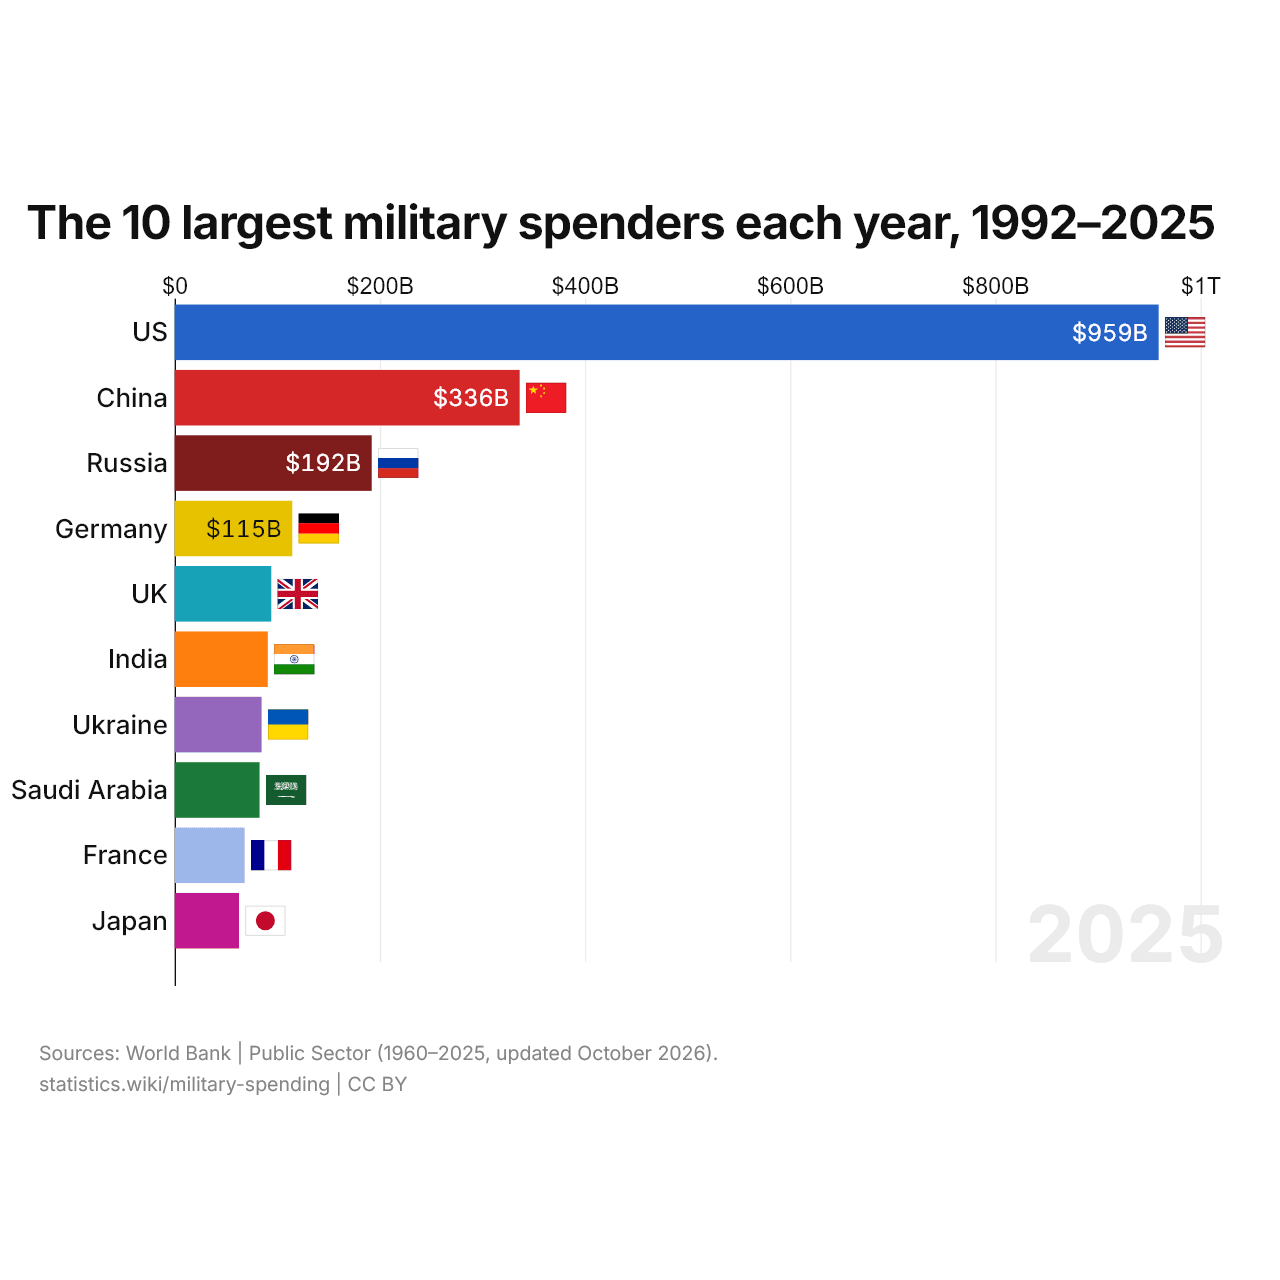
The ten largest spenders accounted for 73% of the world's military spending in 2025, compared with 78% in 1992. China moved up the most among them, from 12th in 1992 to 2nd in 2025.
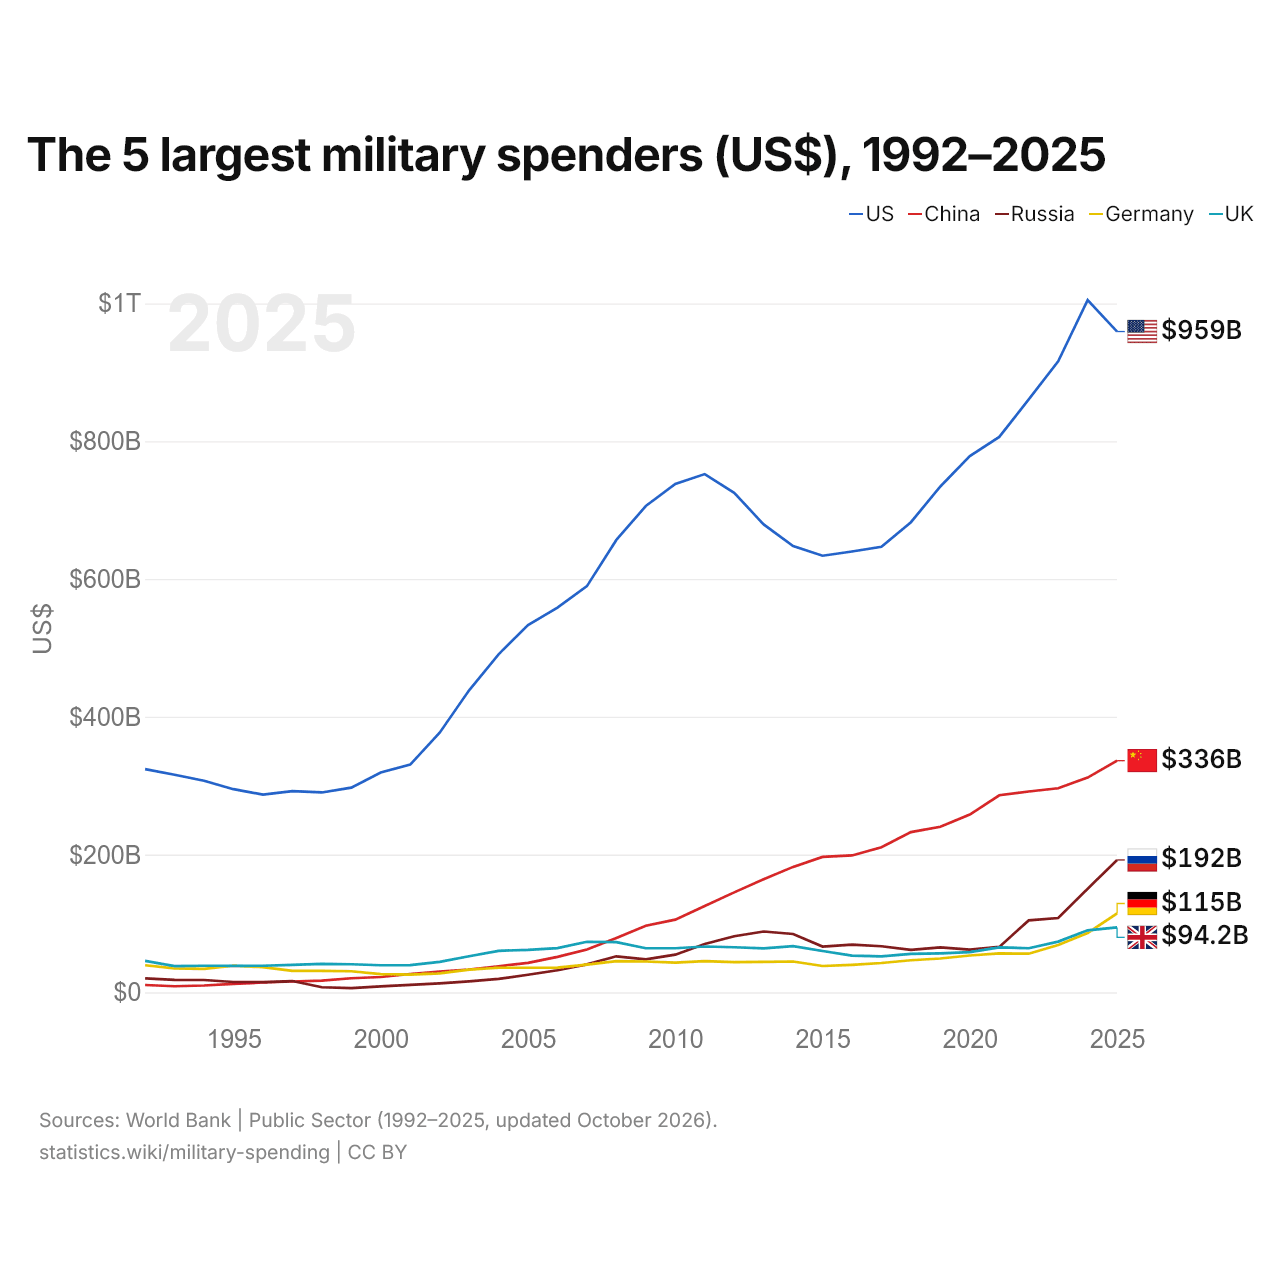
The 5 largest military spenders (US$), 1992–2025
| Year | US$ | ||||
|---|---|---|---|---|---|
| United States | China | Russia | Germany | United Kingdom | |
| 2025 | $959,186,313,861 | $336,287,231,605 | $192,136,289,319 | $114,580,738,373 | $94,191,457,859 |
| 2024 | $1,004,901,006,868 | $311,665,138,265 | $150,300,755,335 | $86,148,285,077 | $90,049,917,899 |
| 2023 | $916,014,700,011 | $296,256,203,951 | $107,874,054,984 | $68,584,873,366 | $73,609,224,259 |
| 2022 | $860,692,190,092 | $291,568,562,171 | $104,442,739,435 | $56,126,481,486 | $63,999,220,561 |
| 2021 | $806,230,182,999 | $286,064,638,567 | $65,918,174,498 | $56,520,202,568 | $65,142,776,433 |
| 2020 | $778,397,181,789 | $258,019,548,371 | $61,883,772,393 | $53,427,936,290 | $58,332,403,452 |
| 2019 | $734,344,099,992 | $240,319,161,881 | $65,141,247,166 | $49,075,254,888 | $56,607,667,129 |
| 2018 | $682,491,399,999 | $232,542,142,774 | $61,649,687,613 | $46,522,788,854 | $55,834,812,244 |
| 2017 | $646,752,894,027 | $210,662,390,407 | $66,887,668,656 | $42,570,391,449 | $52,263,660,506 |
| 2016 | $639,856,408,983 | $198,704,590,486 | $69,267,545,413 | $39,946,006,982 | $53,365,076,946 |
| 2015 | $633,829,638,992 | $196,538,816,914 | $66,422,235,576 | $38,187,112,596 | $59,990,205,719 |
| 2014 | $647,788,988,967 | $182,109,207,418 | $84,696,461,997 | $44,722,314,292 | $66,948,107,043 |
| 2013 | $679,228,987,932 | $164,070,522,281 | $88,352,773,024 | $44,255,214,619 | $63,837,767,008 |
| 2012 | $725,204,999,995 | $145,127,514,112 | $81,469,258,704 | $43,795,742,630 | $65,452,488,707 |
| 2011 | $752,288,024,112 | $125,286,379,045 | $70,237,425,008 | $45,222,375,374 | $66,569,570,092 |
| 2010 | $738,005,000,006 | $105,522,663,688 | $54,669,571,401 | $43,067,897,142 | $63,979,077,809 |
| 2009 | $705,917,009,752 | $96,601,723,318 | $47,977,400,312 | $44,708,128,402 | $64,012,401,357 |
| 2008 | $656,756,022,239 | $78,840,721,778 | $52,308,177,410 | $45,281,516,420 | $72,910,850,458 |
| 2007 | $589,586,040,737 | $62,136,574,418 | $40,531,799,824 | $40,163,939,326 | $73,443,917,278 |
| 2006 | $558,335,000,005 | $51,453,409,257 | $32,136,731,411 | $35,915,569,374 | $64,216,083,503 |
| 2005 | $533,202,999,994 | $42,789,969,318 | $25,451,184,585 | $35,668,473,439 | $61,653,410,844 |
| 2004 | $490,680,798,979 | $37,904,590,328 | $19,505,640,905 | $35,674,739,290 | $60,248,576,365 |
| 2003 | $438,456,791,506 | $33,144,012,495 | $15,797,357,018 | $32,918,257,864 | $52,340,729,449 |
| 2002 | $376,793,905,500 | $30,284,162,946 | $12,976,830,075 | $27,613,123,353 | $44,246,791,241 |
| 2001 | $330,559,335,417 | $26,561,469,416 | $10,873,088,187 | $25,718,269,557 | $39,510,020,470 |
| 2000 | $319,034,448,613 | $22,237,129,406 | $8,588,691,891 | $26,440,465,751 | $39,345,556,718 |
| 1999 | $297,186,838,354 | $20,473,915,095 | $6,020,790,115 | $30,559,153,698 | $40,757,565,046 |
| 1998 | $290,151,387,912 | $17,031,784,314 | $7,404,262,643 | $31,056,338,175 | $41,223,764,341 |
| 1997 | $292,113,872,389 | $15,699,572,881 | $16,358,357,537 | $31,123,148,183 | $39,892,298,526 |
| 1996 | $286,998,050,601 | $14,275,429,174 | $14,715,375,937 | $36,530,138,648 | $38,563,607,691 |
| 1995 | $294,913,089,269 | $12,385,133,924 | $14,968,827,789 | $38,565,764,726 | $38,292,349,331 |
| 1994 | $307,176,284,906 | $9,867,096,438 | $17,872,114,466 | $34,040,112,975 | $38,570,607,266 |
| 1993 | $315,792,081,556 | $8,878,751,200 | $18,192,262,563 | $34,869,461,959 | $38,110,748,981 |
| 1992 | $324,090,689,289 | $10,600,018,367 | $20,377,211,726 | $39,317,399,744 | $45,590,511,426 |
In 2025, the United States spent $959 billion on the military, China $336 billion, Russia $192 billion, Germany $115 billion and the United Kingdom $94.2 billion. The United States' military spending has been the largest of the five every year since 1992. The most recent change in their order came in 2025, when Germany passed the United Kingdom.
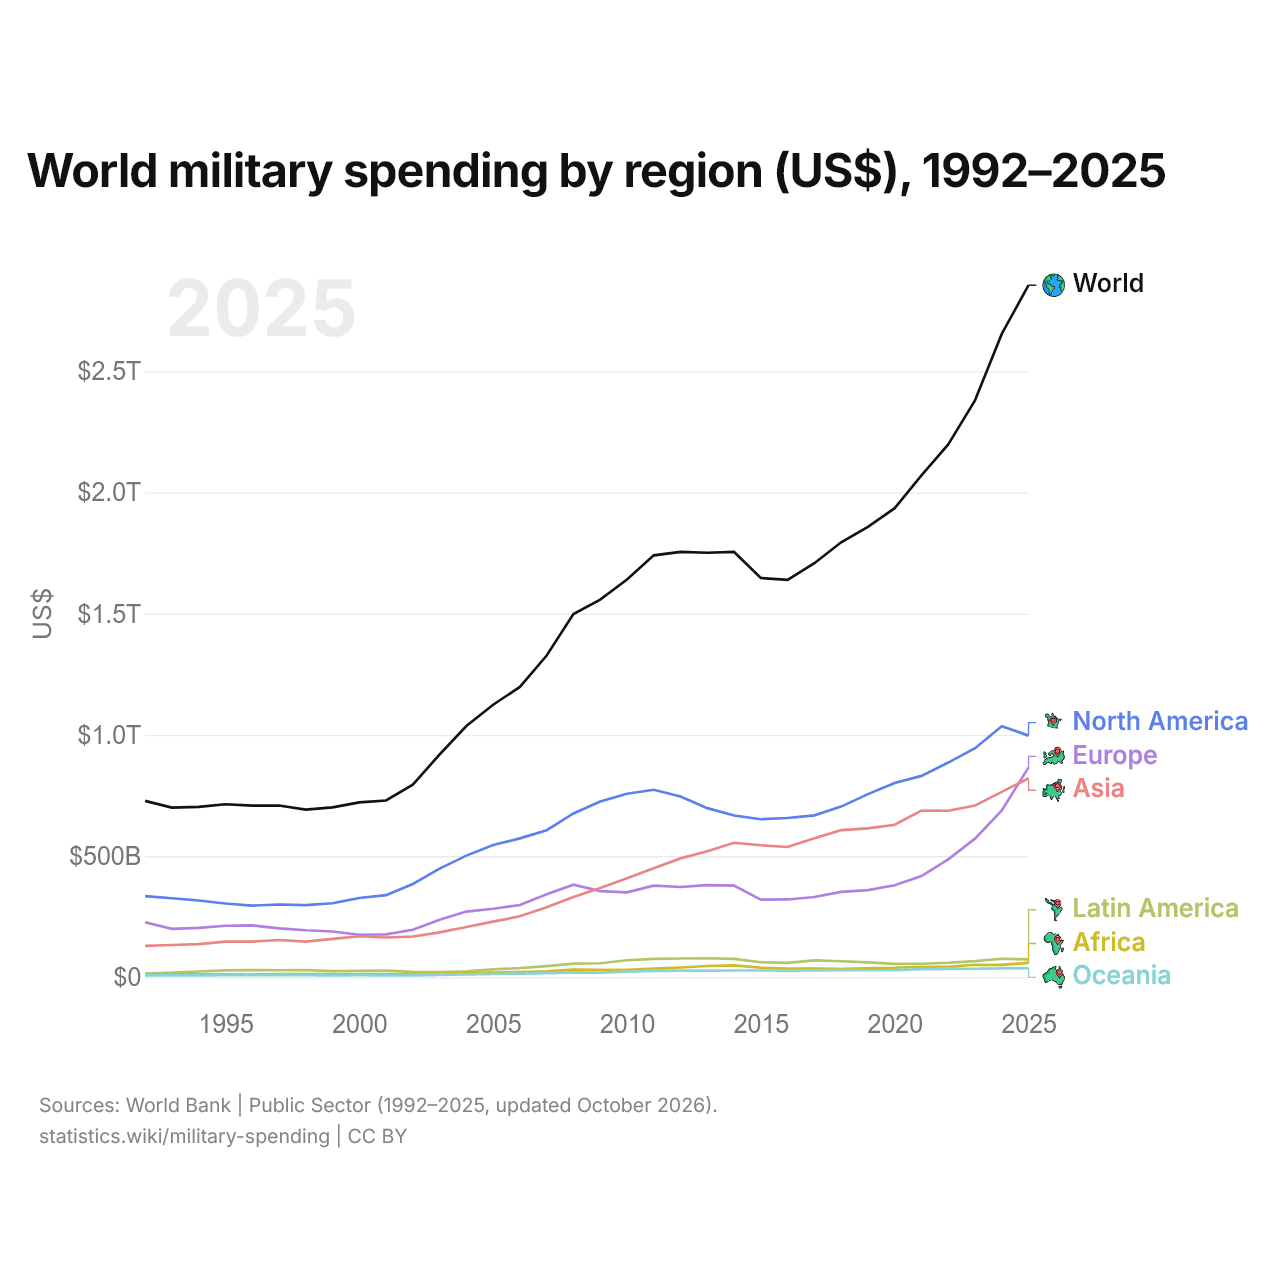
World military spending by region (US$), 1992–2025
| Year | US$ | ||||||
|---|---|---|---|---|---|---|---|
| World | North America | Europe | Asia | Latin America | Africa | Oceania | |
| 2025 | $2,854,780,774,647 | $996,941,462,306 | $865,885,597,574 | $820,905,010,396 | $73,849,852,538 | $59,598,703,947 | $37,600,147,886 |
| 2024 | $2,653,894,889,292 | $1,035,518,569,179 | $688,641,265,015 | $765,017,580,653 | $76,705,647,588 | $51,378,899,658 | $36,632,927,198 |
| 2023 | $2,379,686,880,390 | $944,892,830,627 | $572,060,592,341 | $708,365,941,431 | $67,025,942,675 | $51,900,351,528 | $35,441,221,788 |
| 2022 | $2,198,240,924,000 | $885,814,878,946 | $486,594,069,255 | $687,098,813,466 | $60,197,031,293 | $43,618,242,839 | $34,917,888,201 |
| 2021 | $2,070,028,945,289 | $830,931,083,146 | $417,500,317,652 | $687,923,627,429 | $56,180,601,692 | $43,587,181,887 | $33,906,133,484 |
| 2020 | $1,935,140,836,923 | $801,852,449,560 | $380,026,403,054 | $629,348,981,911 | $55,232,241,010 | $38,974,376,990 | $29,706,384,397 |
| 2019 | $1,858,119,123,697 | $755,624,125,299 | $359,948,584,541 | $614,389,587,534 | $61,970,624,153 | $37,082,294,254 | $29,103,907,916 |
| 2018 | $1,794,361,557,721 | $704,082,627,997 | $352,228,569,640 | $606,907,125,358 | $66,240,947,742 | $35,338,608,382 | $29,563,678,603 |
| 2017 | $1,707,909,059,769 | $668,150,147,404 | $331,227,111,123 | $573,769,498,745 | $69,741,038,205 | $36,108,412,981 | $28,912,851,310 |
| 2016 | $1,639,423,594,560 | $657,322,914,833 | $321,196,783,424 | $537,629,744,316 | $59,631,550,410 | $36,335,102,047 | $27,307,499,529 |
| 2015 | $1,647,221,880,918 | $652,055,686,034 | $320,514,048,888 | $544,602,320,286 | $62,398,743,642 | $39,365,057,795 | $28,286,024,273 |
| 2014 | $1,754,425,328,692 | $667,499,288,534 | $378,169,275,885 | $555,101,499,167 | $76,067,036,438 | $49,362,367,076 | $28,225,861,591 |
| 2013 | $1,751,205,245,028 | $697,738,538,588 | $380,393,189,685 | $519,848,537,430 | $78,650,295,441 | $46,588,088,222 | $27,986,595,663 |
| 2012 | $1,754,997,951,467 | $745,653,456,456 | $372,535,707,763 | $490,582,973,564 | $77,655,965,041 | $40,588,795,449 | $27,981,053,194 |
| 2011 | $1,740,542,604,715 | $773,687,754,012 | $377,881,839,699 | $450,403,090,699 | $75,916,531,198 | $36,024,508,498 | $26,628,880,610 |
| 2010 | $1,641,023,753,616 | $757,321,621,473 | $350,275,367,302 | $408,584,211,539 | $70,591,674,245 | $31,091,301,746 | $23,159,577,310 |
| 2009 | $1,557,837,551,908 | $724,853,271,957 | $355,478,589,197 | $368,762,190,857 | $58,088,970,760 | $31,202,196,116 | $19,452,333,021 |
| 2008 | $1,498,612,615,400 | $676,098,840,763 | $382,032,365,039 | $331,499,170,364 | $56,370,102,560 | $32,022,915,365 | $20,589,221,309 |
| 2007 | $1,327,230,725,819 | $607,003,169,629 | $342,590,156,024 | $289,238,316,402 | $46,486,642,406 | $24,690,481,429 | $17,221,959,930 |
| 2006 | $1,197,635,508,740 | $573,144,370,598 | $298,331,500,082 | $251,646,707,602 | $37,863,419,726 | $21,581,692,554 | $15,067,818,178 |
| 2005 | $1,124,383,688,308 | $546,190,658,555 | $282,688,881,298 | $229,696,416,478 | $32,615,647,018 | $19,328,408,054 | $13,863,676,904 |
| 2004 | $1,036,849,226,208 | $502,017,412,160 | $271,320,277,264 | $207,683,170,666 | $25,087,141,096 | $18,260,715,451 | $12,480,509,572 |
| 2003 | $919,001,054,995 | $448,414,657,926 | $237,698,605,724 | $185,582,600,498 | $21,866,263,792 | $15,602,019,302 | $9,836,907,753 |
| 2002 | $794,985,802,497 | $385,289,377,466 | $195,955,308,932 | $168,575,571,954 | $22,817,853,149 | $13,982,012,634 | $8,365,678,361 |
| 2001 | $729,426,978,072 | $338,934,631,989 | $177,279,085,883 | $164,249,166,926 | $27,330,769,545 | $13,704,361,025 | $7,928,962,704 |
| 2000 | $721,394,751,081 | $327,333,829,699 | $175,684,675,959 | $169,422,653,305 | $27,277,260,669 | $13,192,550,973 | $8,483,780,476 |
| 1999 | $701,023,257,232 | $305,610,728,455 | $189,108,215,733 | $158,616,915,788 | $25,424,187,249 | $13,894,435,584 | $8,368,774,423 |
| 1998 | $691,983,748,627 | $298,116,282,780 | $194,080,182,540 | $147,252,855,562 | $30,193,870,314 | $13,855,304,005 | $8,485,253,426 |
| 1997 | $708,647,710,380 | $300,276,612,346 | $201,905,925,103 | $154,019,925,044 | $29,318,014,947 | $13,786,237,210 | $9,340,995,730 |
| 1996 | $707,935,194,568 | $295,850,226,595 | $214,349,095,231 | $147,353,735,118 | $29,579,663,940 | $11,717,538,923 | $9,084,934,760 |
| 1995 | $713,952,675,546 | $304,330,270,404 | $212,782,778,662 | $147,555,037,510 | $28,720,309,696 | $11,882,742,875 | $8,681,536,399 |
| 1994 | $702,747,844,691 | $317,016,086,142 | $204,294,255,124 | $137,205,462,255 | $24,200,002,538 | $12,096,917,637 | $7,935,120,995 |
| 1993 | $700,065,401,442 | $326,341,010,107 | $200,063,269,694 | $133,318,186,928 | $19,464,127,901 | $13,107,965,690 | $7,770,841,123 |
| 1992 | $727,722,098,356 | $335,156,325,628 | $227,151,010,821 | $129,742,859,578 | $15,730,766,721 | $11,944,058,757 | $7,997,076,852 |
In 2025, North America accounted for 35% of the world's military spending, Europe 30% and Asia 29%. In 1992, North America's share was 46%, Europe's 31% and Asia's 18%.
Compare the military spending of any 2 countries
Sources:
- World Bank | Public Sector (1960–2025, updated October 2026)
- U.S. Census Bureau (2025, updated October 2026)
Creative Commons Attribution (CC BY): you may copy, share, adapt and reuse this content, also commercially, as long as you credit statistics.wiki and note any changes you made. The sources listed above may have their own license terms.