
Arms, ammunition and explosives exports and imports by country, 2025
| Rank | Country | Exports | Imports | Share of world |
|---|---|---|---|---|
 World |
$49.4B | $33.6B | ||
| 1 |  United States |
$9.48B | $5.07B | 19.2% |
| 2 |  Turkey |
$4.79B | $1.38B | 9.7% |
| 3 |  South Korea |
$3.40B | $405M | 6.87% |
| 4 |  Slovakia |
$2.83B | $1.96B | 5.72% |
| 5 |  Bulgaria |
$2.62B | $661M | 5.3% |
| 6 |  Italy |
$2.53B | $752M | 5.11% |
| 7 |  United Kingdom |
$2.44B | $1.58B | 4.94% |
| 8 |  Israel |
$2.38B | $34.5M | 4.8% |
| 9 |  Czech Republic |
$1.81B | $3.58B | 3.66% |
| 10 |  Poland |
$1.71B | $4.31B | 3.46% |
| 11 |  China |
$1.47B | $157M | 2.98% |
| 12 |  India |
$1.39B | $162M | 2.81% |
| 13 |  Spain |
$1.29B | $569M | 2.61% |
| 14 |  Germany |
$1.08B | $876M | 2.19% |
| 15 |  Norway |
$961M | $531M | 1.94% |
| 16 |  Switzerland |
$838M | $384M | 1.7% |
| 17 |  Belgium |
$767M | $271M | 1.55% |
| 18 |  Canada |
$735M | $663M | 1.49% |
| 19 |  France |
$621M | $476M | 1.26% |
| 20 |  Romania |
$610M | $645M | 1.23% |
| 21 |  Austria |
$606M | $302M | 1.23% |
| 22 |  Brazil |
$515M | $429M | 1.04% |
| 23 |  Japan |
$450M | $1.10B | 0.91% |
| 24 |  Egypt |
$444M | $9.10M | 0.9% |
| 25 |  Thailand |
$359M | $177M | 0.73% |
| 26 |  Bosnia |
$356M | $59.3M | 0.72% |
| 27 |  Finland |
$309M | $148M | 0.62% |
| 28 |  Sweden |
$241M | $210M | 0.49% |
| 29 |  Netherlands |
$234M | $535M | 0.47% |
| 30 |  Mexico |
$228M | $302M | 0.46% |
| 31 |  Croatia |
$225M | $103M | 0.45% |
| 32 |  South Africa |
$212M | $129M | 0.43% |
| 33 |  Australia |
$143M | $1.19B | 0.29% |
| 34 |  Peru |
$143M | $207M | 0.29% |
| 35 |  Serbia |
$129M | $91.0M | 0.26% |
| 36 |  Portugal |
$101M | $87.8M | 0.2% |
| 37 |  Greece |
$99.0M | $245M | 0.2% |
| 38 |  Denmark |
$91.4M | $91.0M | 0.18% |
| 39 |  Qatar |
$90.9M (2024) | $774M (2024) | 0.24% |
| 40 |  Slovenia |
$64.0M | $72.5M | 0.13% |
| 41 |  Philippines |
$64.0M | $112M | 0.13% |
| 42 |  Chile |
$46.6M | $93.4M | 0.09% |
| 43 |  Zambia |
$35.8M | $47.4M | 0.07% |
| 44 |  Malaysia |
$31.6M | $154M | 0.06% |
| 45 |  Albania |
$30.8M (2024) | $11.3M (2024) | 0.08% |
| 46 |  Lithuania |
$30.4M | $74.4M | 0.06% |
| 47 |  Ukraine |
$28.6M (2024) | $193M (2024) | 0.07% |
| 48 |  Costa Rica |
$25.5M | $13.1M | 0.05% |
| 49 |  Vietnam |
$22.8M | $32.4M | 0.05% |
| 50 |  Tanzania |
$22.2M | $36.5M | 0.04% |
| 51 |  Montenegro |
$18.9M | $8.54M | 0.04% |
| 52 |  Indonesia |
$18.3M | $598M | 0.04% |
| 53 |  Bolivia |
$17.1M | $33.0M | 0.03% |
| 54 |  Ghana |
$16.6M | $118M | 0.03% |
| 55 |  Singapore |
$15.5M | $57.3M | 0.03% |
| 56 |  Ireland |
$12.7M | $12.8M | 0.03% |
| 57 |  Djibouti |
$12.6M (2023) | $464K (2023) | 0.04% |
| 58 |  UAE |
$12.5M (2024) | $61.1M (2024) | 0.03% |
| 59 |  Kenya |
$12.4M | $27.9M | 0.03% |
| 60 |  Cyprus |
$12.1M | $21.6M | 0.02% |
| 61 |  Suriname |
$11.7M | $11.3M | 0.02% |
| 62 |  Estonia |
$10.3M | $404M | 0.02% |
| 63 |  Uganda |
$10.0M | $5.14M | 0.02% |
| 64 |  Colombia |
$9.08M | $111M | 0.02% |
| 65 |  Pakistan |
$8.73M | $32.2M | 0.02% |
| 66 |  Cameroon |
$8.61M (2024) | $8.80M (2024) | 0.02% |
| 67 |  Guatemala |
$8.54M | $65.0M | 0.02% |
| 68 |  Latvia |
$8.53M | $155M | 0.02% |
| 69 |  Bahrain |
$8.15M | $3.49M | 0.02% |
| 70 |  Oman |
$8.05M | $89.3M | 0.02% |
| 71 |  New Zealand |
$8.01M | $67.7M | 0.02% |
| 72 |  Panama |
$7.56M | $15.0M | 0.02% |
| 73 |  Tajikistan |
$6.31M (2024) | $25.6M (2024) | 0.02% |
| 74 |  Kazakhstan |
$6.14M | $47.5M | 0.01% |
| 75 |  Argentina |
$6.03M | $60.4M | 0.01% |
| 76 |  Cambodia |
$4.92M | $11.3M | 0.01% |
| 77 |  Saudi Arabia |
$4.42M | $44.3M | 0.009% |
| 78 |  Georgia |
$4.25M | $28.5M | 0.009% |
| 79 |  Mozambique |
$4.20M | $10.2M | 0.008% |
| 80 |  Dominican Republic |
$3.60M | $54.0M | 0.007% |
| 81 |  Kyrgyzstan |
$3.55M | $11.3M | 0.007% |
| 82 |  Burkina Faso |
$3.15M | $48.0M | 0.006% |
| 83 |  El Salvador |
$2.97M | $10.3M | 0.006% |
| 84 |  Angola |
$2.86M | $44.8M | 0.006% |
| 85 |  Honduras |
$2.59M (2024) | $14.7M (2024) | 0.007% |
| 86 |  Lebanon |
$2.03M (2024) | $23.3M (2024) | 0.005% |
| 87 |  Ecuador |
$1.75M | $61.3M | 0.004% |
| 88 |  Morocco |
$1.67M | $18.2M | 0.003% |
| 89 |  Tunisia |
$1.67M (2024) | $5.07M (2024) | 0.004% |
| 90 |  Senegal |
$1.66M | $18.1M | 0.003% |
| 91 |  Sri Lanka |
$1.65M | $5.39M | 0.003% |
| 92 |  Nigeria |
$1.15M | $57.8M | 0.002% |
| 93 |  Turkmenistan |
$1.04M | $8.47M | 0.002% |
| 94 |  Mali |
$1.03M (2024) | $14.1M (2024) | 0.003% |
| 95 |  Papua New Guinea |
$1.02M (2024) | $11.7M (2024) | 0.003% |
| 96 |  Hungary |
$996K | $19.2M | 0.002% |
| 97 |  Laos |
$938K | $36.4M | 0.002% |
| 98 |  DR Congo |
$883K | $80.0M | 0.002% |
| 99 |  Luxembourg |
$686K | $13.6M | 0.001% |
| 100 |  Kuwait |
$632K | $22.1M | 0.001% |
| 101 |  Ivory Coast |
$602K | $22.2M | 0.001% |
| 102 |  Namibia |
$576K | $21.0M | 0.001% |
| 103 |  Rwanda |
$518K | $8.08M | 0.001% |
| 104 |  Uzbekistan |
$330K (2024) | $43.8M (2024) | <0.001% |
| 105 |  Guyana |
$324K | $32.9M | <0.001% |
| 106 |  North Korea |
$303K | $97.0K (2023) | <0.001% |
| 107 |  Zimbabwe |
$290K | $81.0M | <0.001% |
| 108 |  Malawi |
$280K | $35.8M | <0.001% |
| 109 |  Togo |
$257K | $23.4M | <0.001% |
| 110 |  Andorra |
$245K | $2.43M | <0.001% |
| 111 |  Equatorial Guinea |
$241K (2023) | $1.24M | <0.001% |
| 112 |  Trinidad |
$219K | $4.69M | <0.001% |
| 113 |  Bahamas |
$189K | $1.14M | <0.001% |
| 114 |  Monaco |
$186K | $478K (2009) | <0.001% |
| 115 |  North Macedonia |
$185K | $9.70M | <0.001% |
| 116 |  Malta |
$180K | $3.08M | <0.001% |
| 117 |  Fiji |
$170K | $4.67M | <0.001% |
| 118 |  Liberia |
$151K | $12.6M | <0.001% |
| 119 |  Ethiopia |
$142K (2023) | $11.7M (2023) | <0.001% |
| 120 |  Grenada |
$135K (2024) | $360K (2024) | <0.001% |
| 121 |  Iceland |
$65.0K | $8.61M | <0.001% |
| 122 |  Nauru |
$45.0K | $59.0K | <0.001% |
| 123 |  East Timor |
$44.0K (2023) | $490K (2023) | <0.001% |
| 123 |  Mongolia |
$44.0K | $26.7M | <0.001% |
| 125 |  Jamaica |
$43.0K | $6.59M | <0.001% |
| 126 |  Brunei |
$39.0K | $1.42M | <0.001% |
| 127 |  Marshall Islands |
$30.0K | $139K | <0.001% |
| 128 |  Mauritius |
$29.0K | $2.52M | <0.001% |
| 129 |  Palestine |
$25.0K (2024) | $1.36M (2024) | <0.001% |
| 130 |  Botswana |
$24.0K | $12.4M | <0.001% |
| 130 |  Eswatini |
$24.0K (2024) | $4.55M (2024) | <0.001% |
| 132 |  Moldova |
$18.0K | $3.46M | <0.001% |
| 133 |  Armenia |
$15.0K | $6.03M | <0.001% |
| 134 |  Congo |
$11.0K (2024) | $8.48M (2024) | <0.001% |
| 135 |  Barbados |
$4.00K | $1.69M | <0.001% |
| 136 |  Jordan |
$3.00K | $3.18M | <0.001% |
| 137 |  Azerbaijan |
$1.00K | $5.28M | <0.001% |
| 137 |  Burundi |
$1.00K | $41.1M | <0.001% |
| 137 |  Lesotho |
$1.00K | $8.44M | <0.001% |
| 137 |  Yemen |
$1.00K | $387K | <0.001% |
| 141 |  Algeria |
$0 (2024) | $6.45M (2024) | 0% |
| 141 |  Antigua |
$0 | $676K | 0% |
| 141 |  Belize |
$0 | $1.50M | 0% |
| 141 |  Benin |
$0 | $6.79M | 0% |
| 141 |  Bhutan |
$0 | $1.96M | 0% |
| 141 |  Cape Verde |
$0 | $540K | 0% |
| 141 |  Cayman Islands |
$0 (2024) | $1.17M (2024) | 0% |
| 141 |  CAR |
$0 (2024) | $1.05M (2024) | 0% |
| 141 |  Chad |
$0 | $2.74M | 0% |
| 141 |  Comoros |
$0 | $57.0K | 0% |
| 141 |  Dominica |
$0 (2023) | $245K (2023) | 0% |
| 141 |  Gabon |
$0 | $7.31M | 0% |
| 141 |  Gambia |
$0 (2024) | $264K (2024) | 0% |
| 141 |  Iran |
$0 (2023) | $0 (2023) | 0% |
| 141 |  Iraq |
$0 (2024) | $401M (2024) | 0% |
| 141 |  Madagascar |
$0 | $3.39M | 0% |
| 141 |  Maldives |
$0 | $1.33M | 0% |
| 141 |  Mauritania |
$0 | $16.9M | 0% |
| 141 |  Myanmar |
$0 | $231K | 0% |
| 141 |  Nicaragua |
$0 | $34.7M | 0% |
| 141 |  Niger |
$0 | $10.5M | 0% |
| 141 |  Paraguay |
$0 | $9.29M | 0% |
| 141 |  Saint Vincent |
$0 (2023) | $306K (2023) | 0% |
| 141 |  Samoa |
$0 | $69.0K | 0% |
| 141 |  Sao Tome |
$0 | $173K | 0% |
| 141 |  Seychelles |
$0 | $701K | 0% |
| 141 |  Solomon Islands |
$0 | $3.22M | 0% |
| 141 |  South Sudan |
$0 | $363K | 0% |
| 141 |  Tonga |
$0 | $242K | 0% |
| 141 |  Uruguay |
$0 | $8.11M | 0% |
| Not ranked: latest data before 2023 | ||||
 Belarus |
$6.24M (2021) | $7.35M (2021) | 0.03% | |
 Sierra Leone |
$5.52M (2018) | $4.31M (2018) | 0.03% | |
 Sudan |
$4.53M (2018) | $35.0M (2018) | 0.02% | |
 Bangladesh |
$3.30M (2018) | $180M (2018) | 0.02% | |
 Syria |
$1.44M (2010) | $3.15M (2010) | 0.009% | |
 Cuba |
$348K (2022) | $845K (2022) | 0.001% | |
 Curacao |
$257K (2020) | $565K (2020) | 0.001% | |
 Guinea |
$249K (2016) | $8.01M (2016) | 0.001% | |
 Nepal |
$63.0K (2022) | $39.3M (2022) | <0.001% | |
 Haiti |
$18.0K (2017) | $1.94M (2017) | <0.001% | |
 Saint Lucia |
$5.00K (2020) | $625K (2020) | <0.001% | |
 Vanuatu |
$3.00K (2011) | $286K (2011) | <0.001% | |
 Saint Kitts |
$2.00K (2017) | $195K (2017) | <0.001% | |
 Somalia |
$1.00K (2021) | $5.27M | <0.001% | |
 Afghanistan |
$0 (2019) | $13.3M (2019) | 0% | |
 Eritrea |
$0 (2003) | $169K (2003) | 0% | |
 Guinea-Bissau |
$0 (2018) | $7.00K (2018) | 0% | |
 Kiribati |
$0 (2021) | $61.0K (2021) | 0% | |
 Libya |
$0 (2019) | $1.75M (2019) | 0% | |
 Palau |
$0 (2018) | $113K (2018) | 0% | |
 Russia |
$0 (2021) | $0 (2021) | 0% | |
 Tuvalu |
$0 (2002) | $3.00K (2002) | 0% | |
 Venezuela |
$0 (2013) | $24.8M (2013) | 0% | |
The list ranks 170 countries by their latest exports of arms and ammunition as customs record them, from the United States ($9.48 billion) to Yemen ($1,000). Of these, 30 reported none. The world's exports of arms and ammunition were $49.4 billion in 2025. Half of the countries exported less than $2.31 million.
The figures are the trade in arms and ammunition as customs record it, in US dollars: weapons, their parts and accessories and ammunition, together with explosives, fireworks and matches. Aircraft, warships and military vehicles are not included, and some large exporters do not report this trade, so the figures are not the whole arms trade.
Arms and ammunition trade by country map
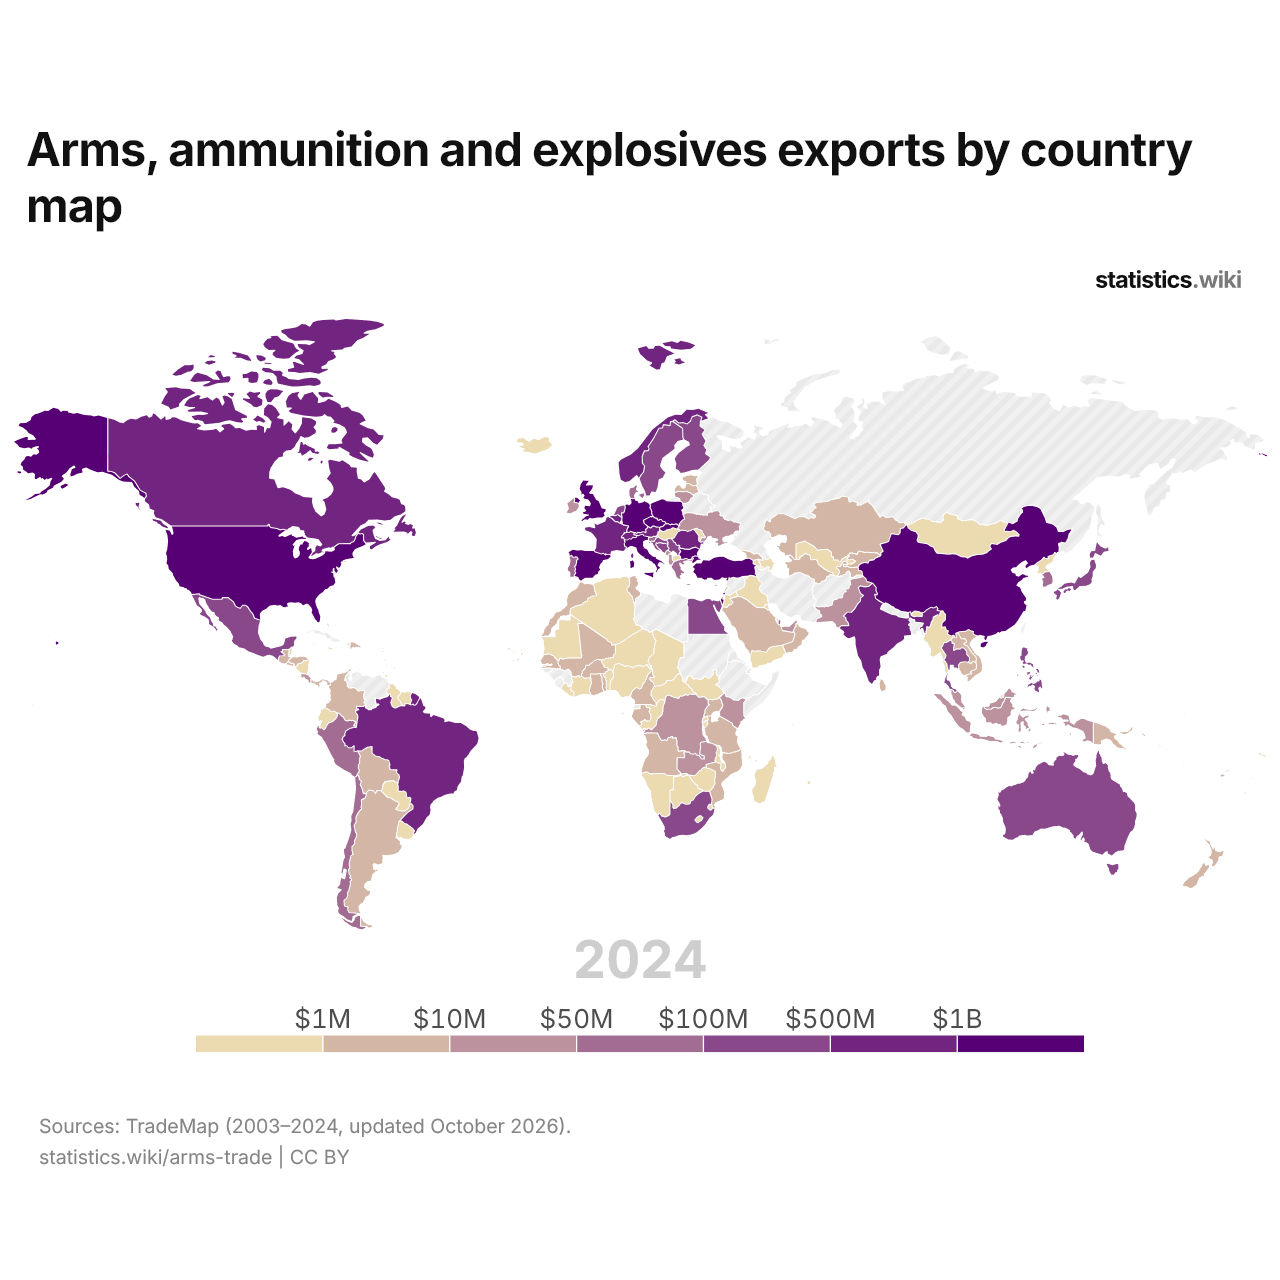
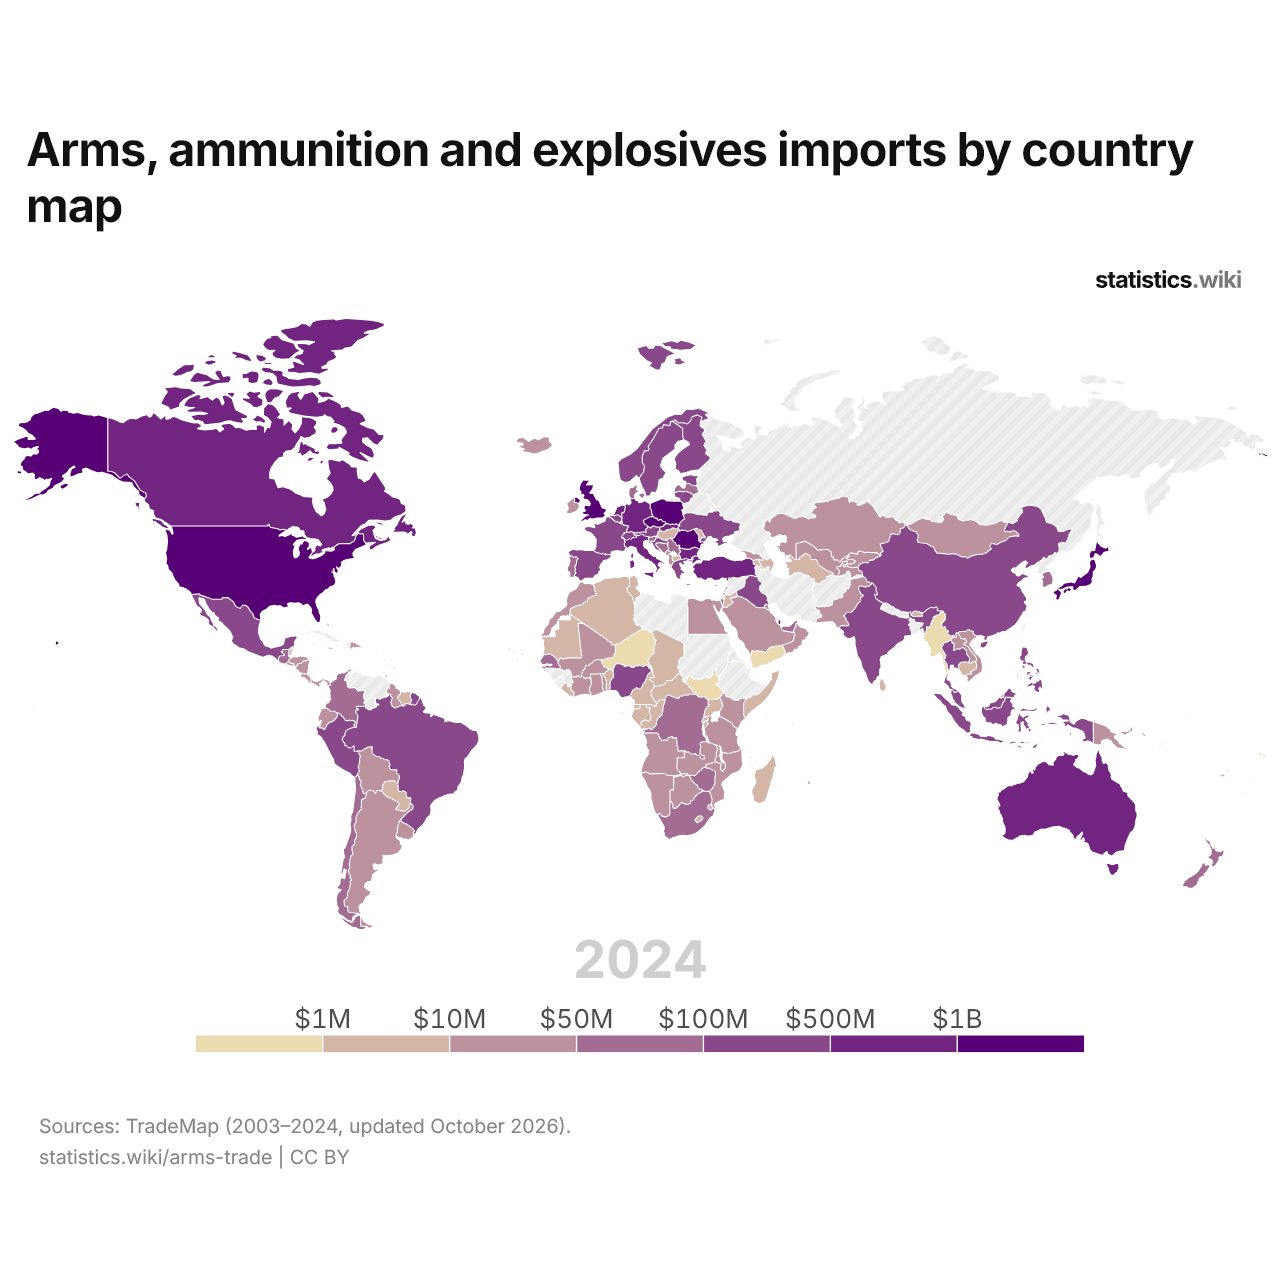
Exports of arms and ammunition are more than $1 billion in 12 countries and less than $1 million in 67; in 2003, the numbers were 1 and 92. Imports are more than $1 billion in 6 countries and less than $1 million in 15; in 2003, the numbers were 1 and 35.
The 5 largest arms and ammunition exporters, 2001–2025
| Year | US$ | ||||
|---|---|---|---|---|---|
| United States | Turkey | South Korea | Slovakia | Bulgaria | |
| 2025 | $9,477,299,000 | $4,793,950,000 | $3,395,344,000 | $2,825,765,000 | $2,621,634,000 |
| 2024 | $7,429,910,000 | $2,692,909,000 | $63,587,000 | $1,242,753,000 | $2,822,797,000 |
| 2023 | $6,649,084,000 | $1,774,883,000 | $1,379,095,000 | $583,515,000 | $2,178,953,000 |
| 2022 | $5,628,890,000 | $1,194,043,000 | $1,346,985,000 | $405,916,000 | $8,616,000 |
| 2021 | $4,901,637,000 | $1,115,024,000 | $1,034,036,000 | $125,440,000 | $567,738,000 |
| 2020 | $4,899,562,000 | $675,619,000 | $890,460,000 | $109,864,000 | $4,929,000 |
| 2019 | $6,758,749,000 | $429,935,000 | $571,896,000 | $107,771,000 | $6,997,000 |
| 2018 | $6,324,727,000 | $320,323,000 | $722,573,000 | $115,380,000 | $6,641,000 |
| 2017 | $6,068,068,000 | $322,790,000 | $646,453,000 | $91,737,000 | $4,528,000 |
| 2016 | $6,223,913,000 | $443,866,000 | $579,185,000 | $63,653,000 | $4,618,000 |
| 2015 | $5,882,169,000 | $471,119,000 | $467,513,000 | $64,502,000 | $4,312,000 |
| 2014 | $5,414,440,000 | $551,427,000 | $480,916,000 | $48,309,000 | $5,002,000 |
| 2013 | $5,475,345,000 | $468,076,000 | $418,325,000 | $22,299,000 | $6,132,000 |
| 2012 | $4,929,655,000 | $359,565,000 | $395,896,000 | $18,992,000 | $6,110,000 |
| 2011 | $4,748,310,000 | $256,323,000 | $279,935,000 | $15,887,000 | $6,535,000 |
| 2010 | $4,780,847,000 | $203,206,000 | $261,721,000 | $21,621,000 | $5,010,000 |
| 2009 | $4,074,366,000 | $147,651,000 | $224,106,000 | $26,413,000 | $4,781,000 |
| 2008 | $3,834,251,000 | $210,161,000 | $238,910,000 | $24,357,000 | $5,117,000 |
| 2007 | $3,835,311,000 | $171,343,000 | $167,135,000 | $33,863,000 | $3,943,000 |
| 2006 | $3,517,136,000 | $131,449,000 | $134,542,000 | $36,410,000 | $2,248,000 |
| 2005 | $2,771,529,000 | $92,574,000 | $105,593,000 | $32,122,000 | $1,774,000 |
| 2004 | $2,790,612,000 | $88,289,000 | $87,198,000 | $13,620,000 | $4,569,000 |
| 2003 | $2,213,722,000 | $84,096,000 | $107,639,000 | $8,850,000 | $4,937,000 |
| 2002 | $2,404,091,000 | $53,969,000 | $58,381,000 | $14,285,000 | $4,237,000 |
| 2001 | $2,450,930,000 | $30,884,000 | $74,598,000 | $14,459,000 | $3,398,000 |
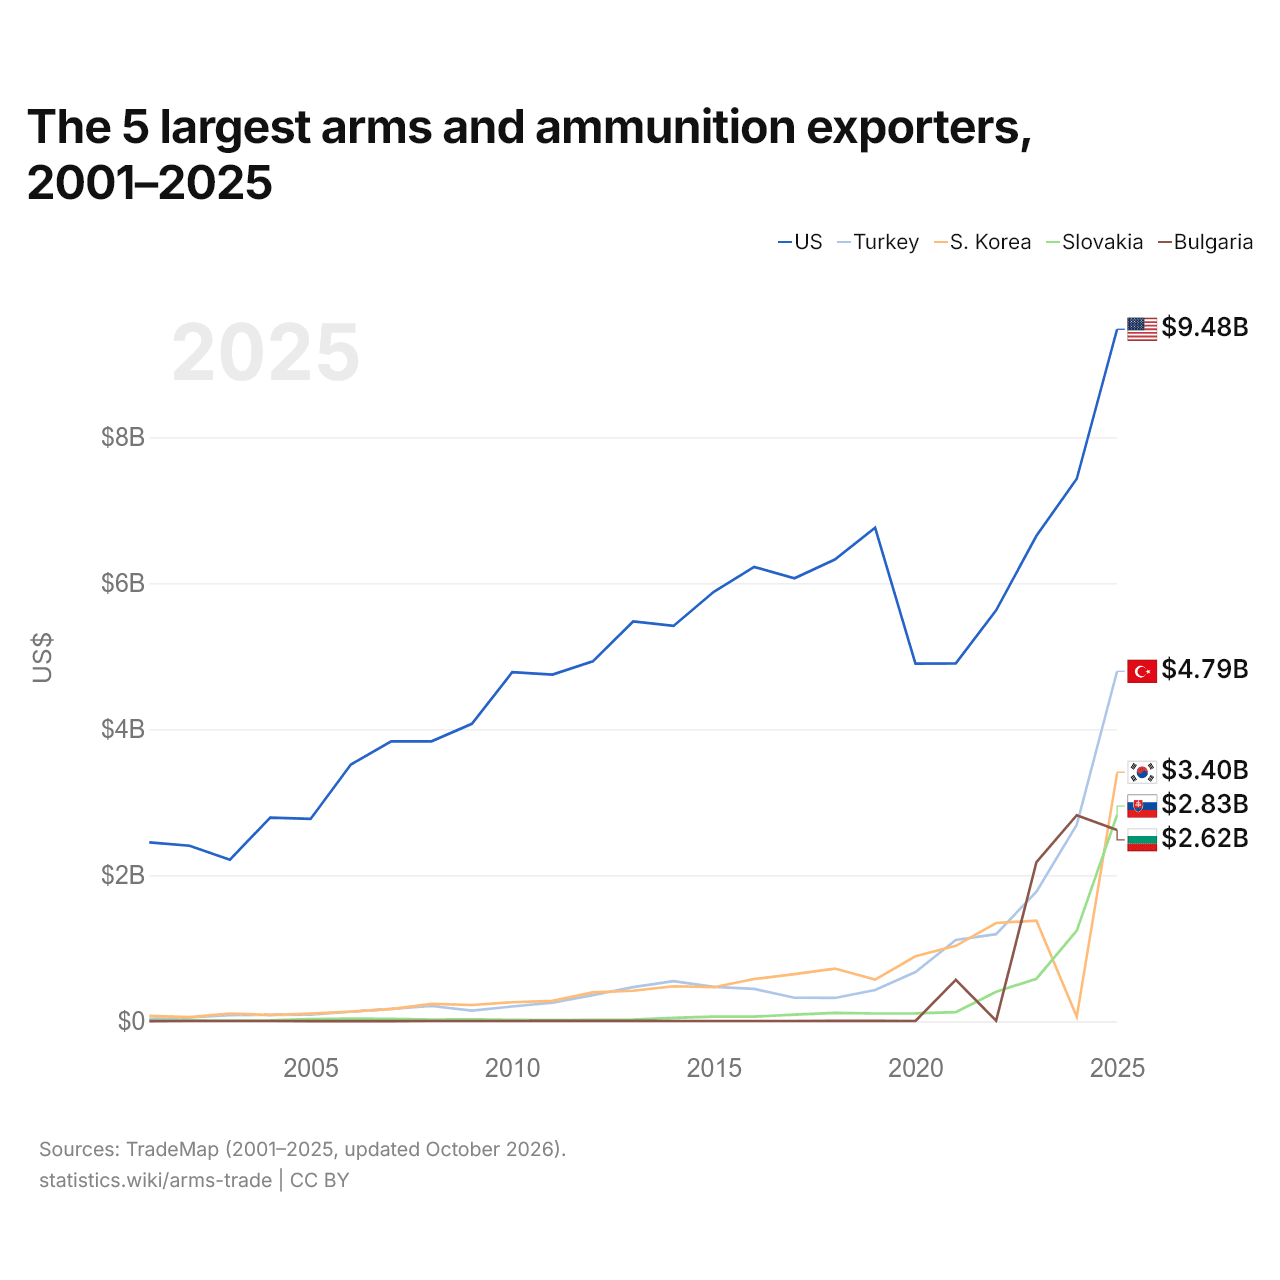
In 2025, exports of arms and ammunition were $9.48 billion from the United States, $4.79 billion from Turkey, $3.4 billion from South Korea, $2.83 billion from Slovakia and $2.62 billion from Bulgaria. The United States' exports have been the largest of the five every year since 2001. The most recent change in their order came in 2025, when South Korea passed Slovakia.
The 10 largest arms and ammunition exporters each year
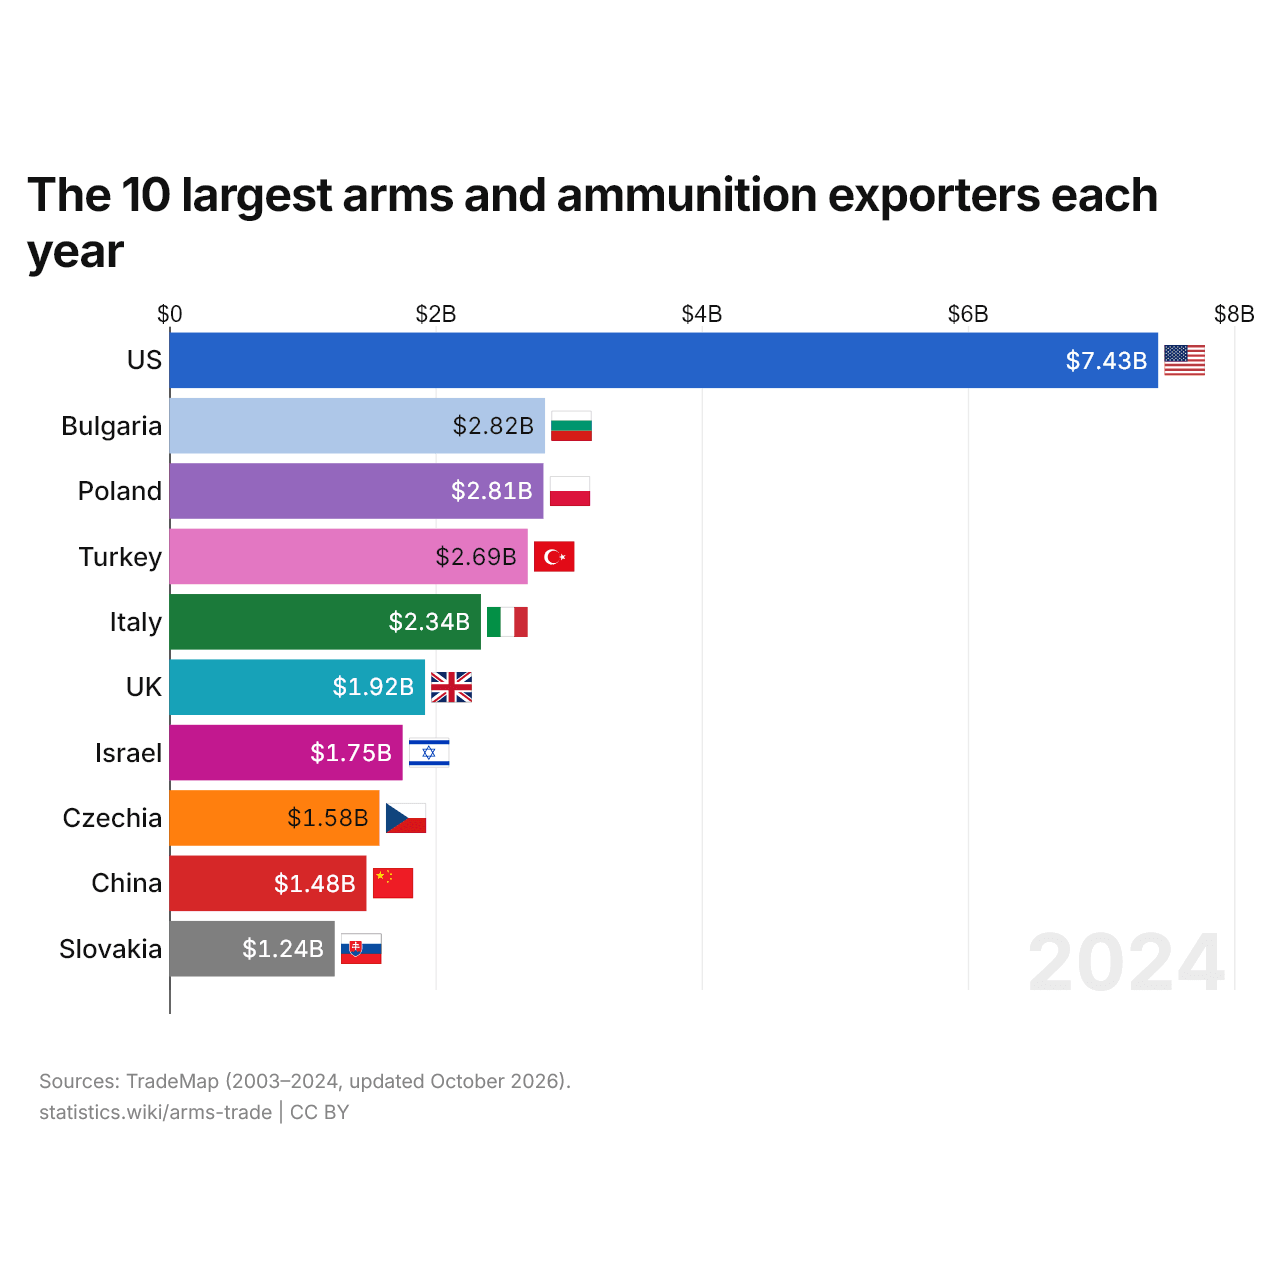
The ten largest exporters accounted for 68% of the world's exports of arms and ammunition in 2024, compared with 76% in 2003. Bulgaria moved up the most among them, from 50th in 2003 to 2nd in 2024.
Compare the arms and ammunition trade of any 2 countries
Sources:
- TradeMap (2001–2025, updated October 2026)
Creative Commons Attribution (CC BY): you may copy, share, adapt and reuse this content, also commercially, as long as you credit statistics.wiki and note any changes you made. The sources listed above may have their own license terms.